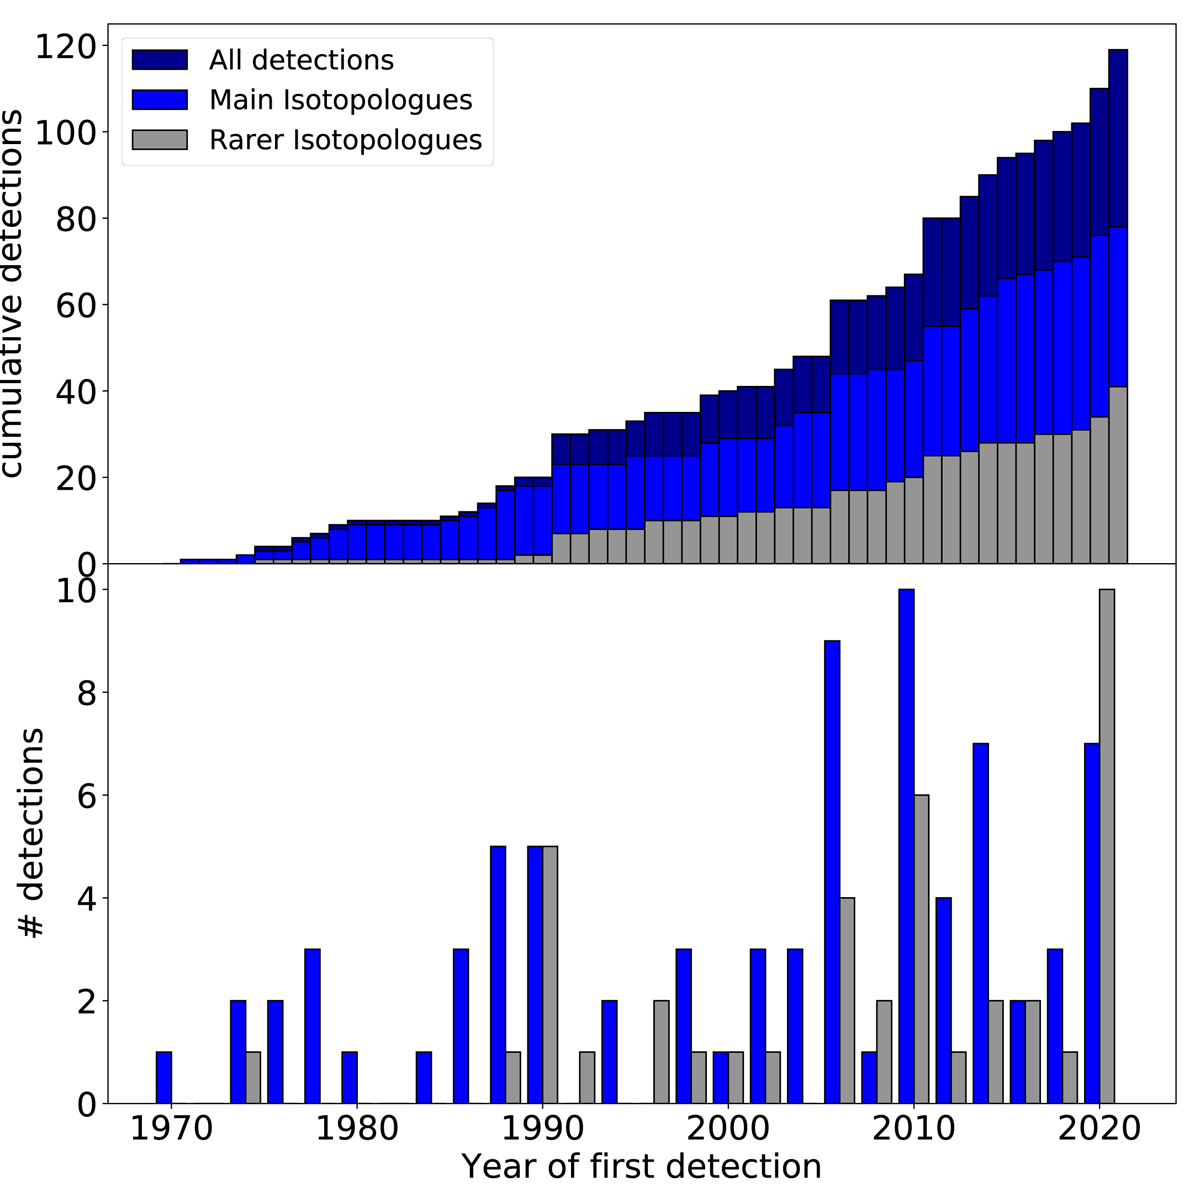
Fig. 9.
Download original image
Chronology of extragalactic molecular detections including those reported in this work. Detections of main and rarer isotopologue substitutions in blue and gray respectively, with the total number of detections, not considering tentative reports, being displayed in dark blue. One and two year bins are used for top and bottom panel histograms, respectively.
Current usage metrics show cumulative count of Article Views (full-text article views including HTML views, PDF and ePub downloads, according to the available data) and Abstracts Views on Vision4Press platform.
Data correspond to usage on the plateform after 2015. The current usage metrics is available 48-96 hours after online publication and is updated daily on week days.
Initial download of the metrics may take a while.