Fig. 8.
Download original image
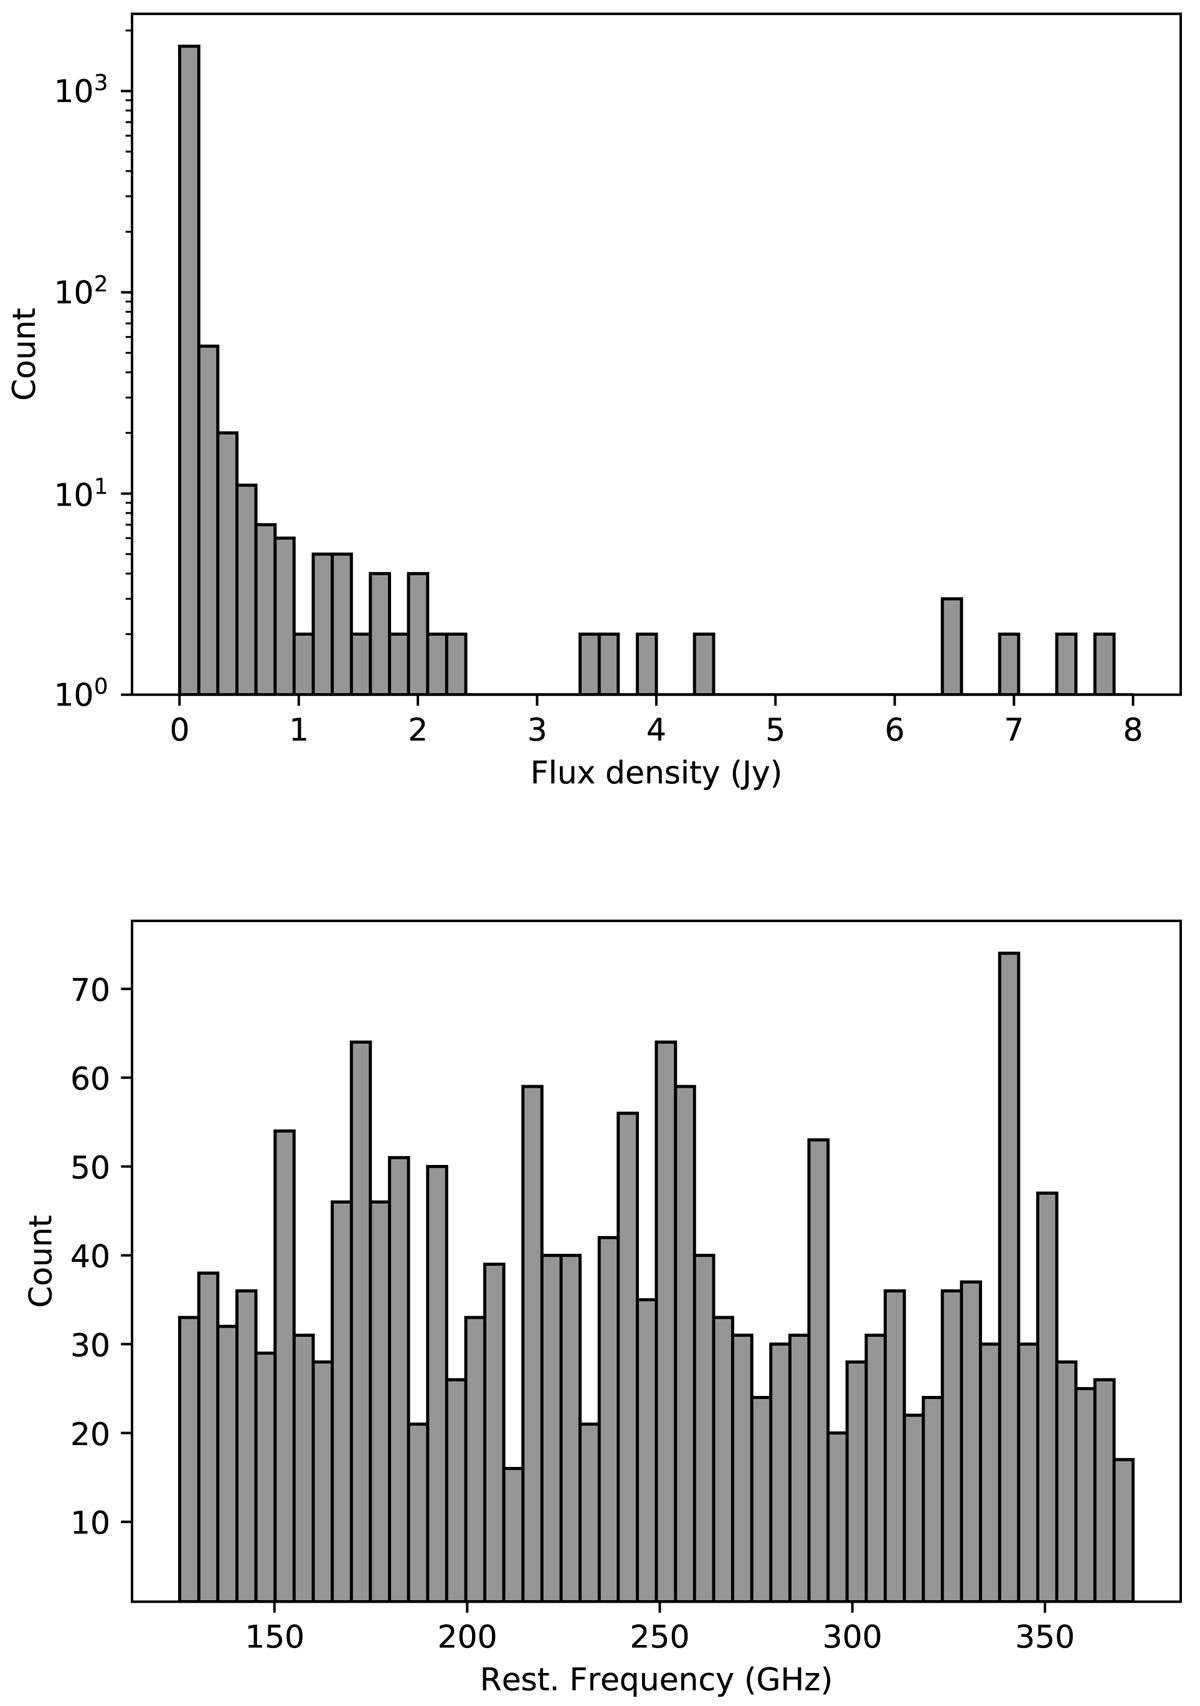
Top: histogram showing the number of spectral lines above 2 mJy in the model in bins of flux density. Lines between 2 mJy and 10 Jy are considered. The three spectral features with flux densities above 10 Jy are not included in this diagram. Bottom: histogram showing the number of spectral lines above 2 mJy in frequency bins of ∼5 GHz width.
Current usage metrics show cumulative count of Article Views (full-text article views including HTML views, PDF and ePub downloads, according to the available data) and Abstracts Views on Vision4Press platform.
Data correspond to usage on the plateform after 2015. The current usage metrics is available 48-96 hours after online publication and is updated daily on week days.
Initial download of the metrics may take a while.