Fig. 7.
Download original image
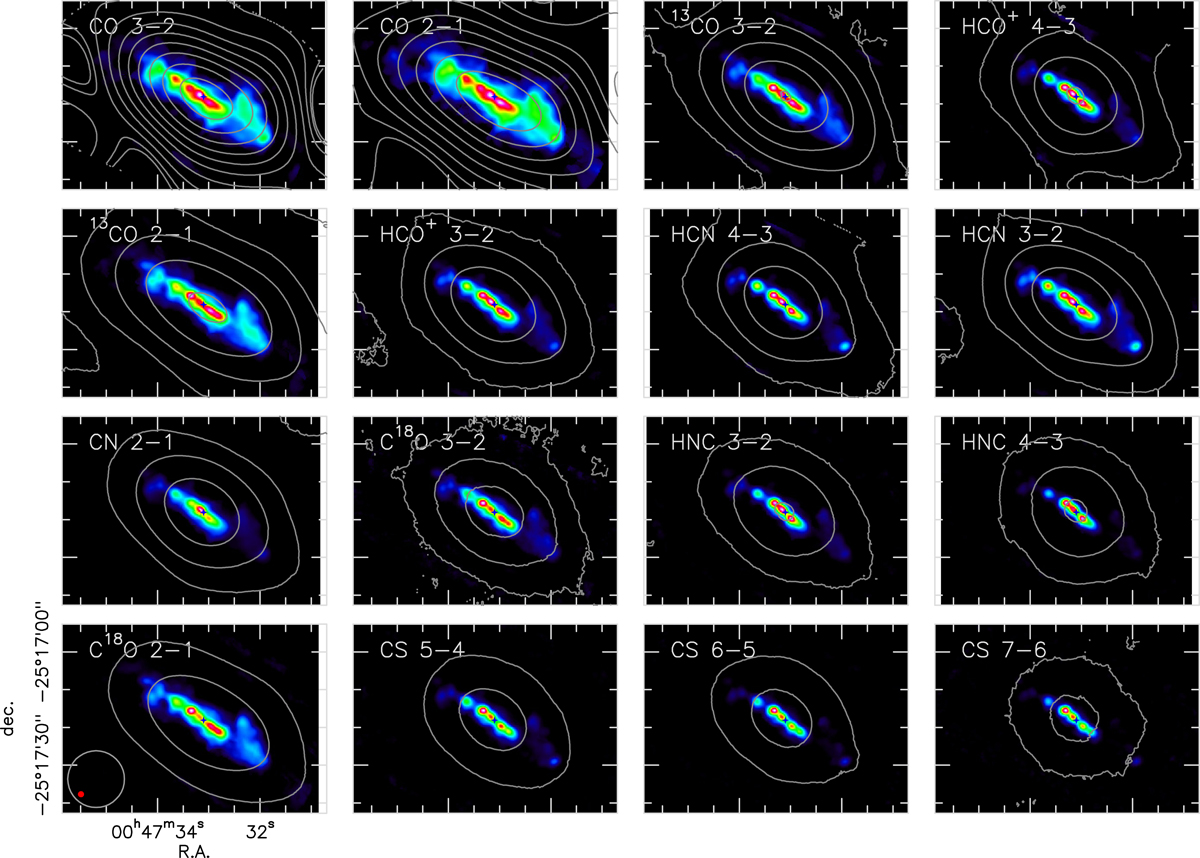
Sample of integrated flux density moment 0 maps from 16 of the brightest molecular transitions in the covered frequency band. Each panel is labeled with the corresponding molecular species and transition. We point out that CO 1 − 0 is not included since Band 3 is not covered by the ACA data. In color the combined 12 m+7 m maps are shown where the color coding is adjusted for visibility of each individual species. Gray contours show the 7 m integrated intensity images where the n-th contour level corresponds to 20 n3 Jy km s−1 beam−1 for all species. Species are ordered in decreasing order of integrated flux density from left to right and from top to bottom. The panel in the lower left shows the reference coordinates and the beam size of the combined 12 m+7 m (![]() , filled red circle) and 7 m data (15″, gray line), which are shared by all tunings. The blue cross at the center of every map shows the selected position (Sect. 4.3.1) from which we extracted the spectra for modeling (Sect. 4.3.2) and for presentation in Fig. 4.
, filled red circle) and 7 m data (15″, gray line), which are shared by all tunings. The blue cross at the center of every map shows the selected position (Sect. 4.3.1) from which we extracted the spectra for modeling (Sect. 4.3.2) and for presentation in Fig. 4.
Current usage metrics show cumulative count of Article Views (full-text article views including HTML views, PDF and ePub downloads, according to the available data) and Abstracts Views on Vision4Press platform.
Data correspond to usage on the plateform after 2015. The current usage metrics is available 48-96 hours after online publication and is updated daily on week days.
Initial download of the metrics may take a while.