Free Access
Fig. 6.
Download original image
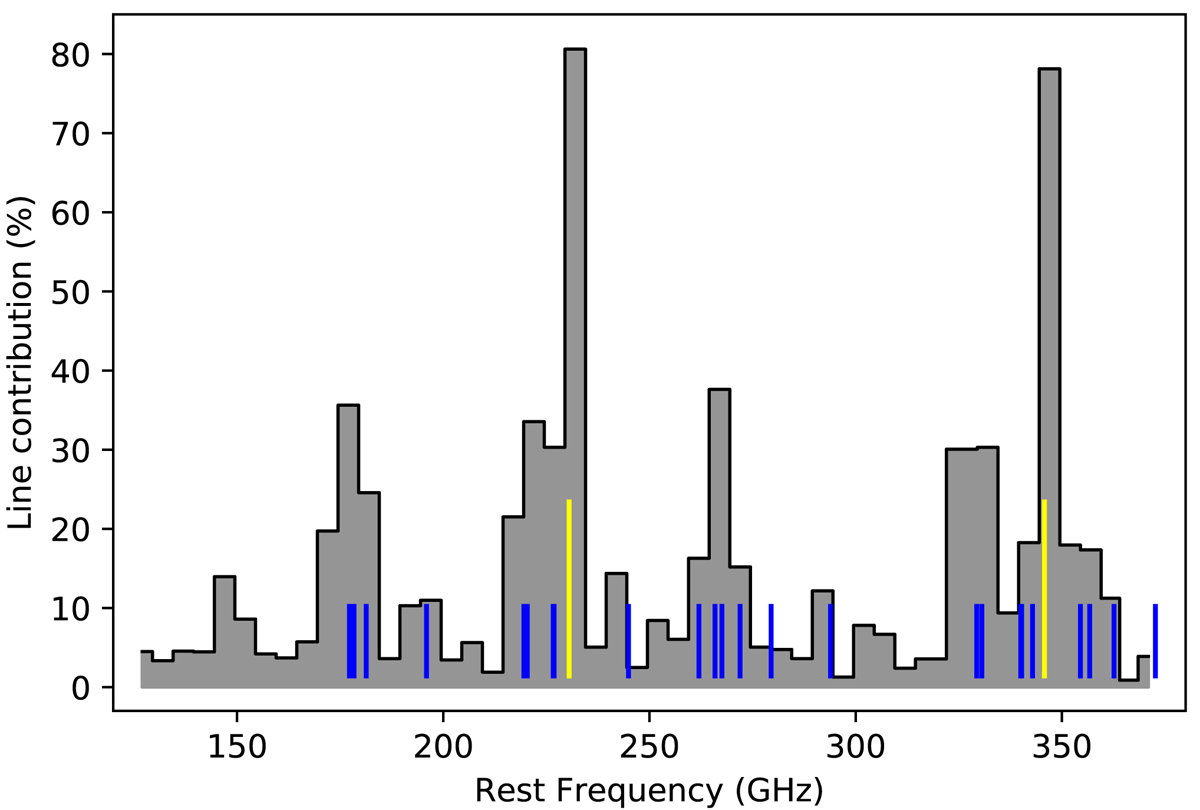
Spectral line contribution to the continuum flux in 5 GHz bins. The position of spectral features brighter than 1 Jy are shown as blue segments at their corresponding frequency, with the two CO J = 2 − 1 and 3 − 2 transitions displayed in yellow.
Current usage metrics show cumulative count of Article Views (full-text article views including HTML views, PDF and ePub downloads, according to the available data) and Abstracts Views on Vision4Press platform.
Data correspond to usage on the plateform after 2015. The current usage metrics is available 48-96 hours after online publication and is updated daily on week days.
Initial download of the metrics may take a while.