Fig. 5.
Download original image
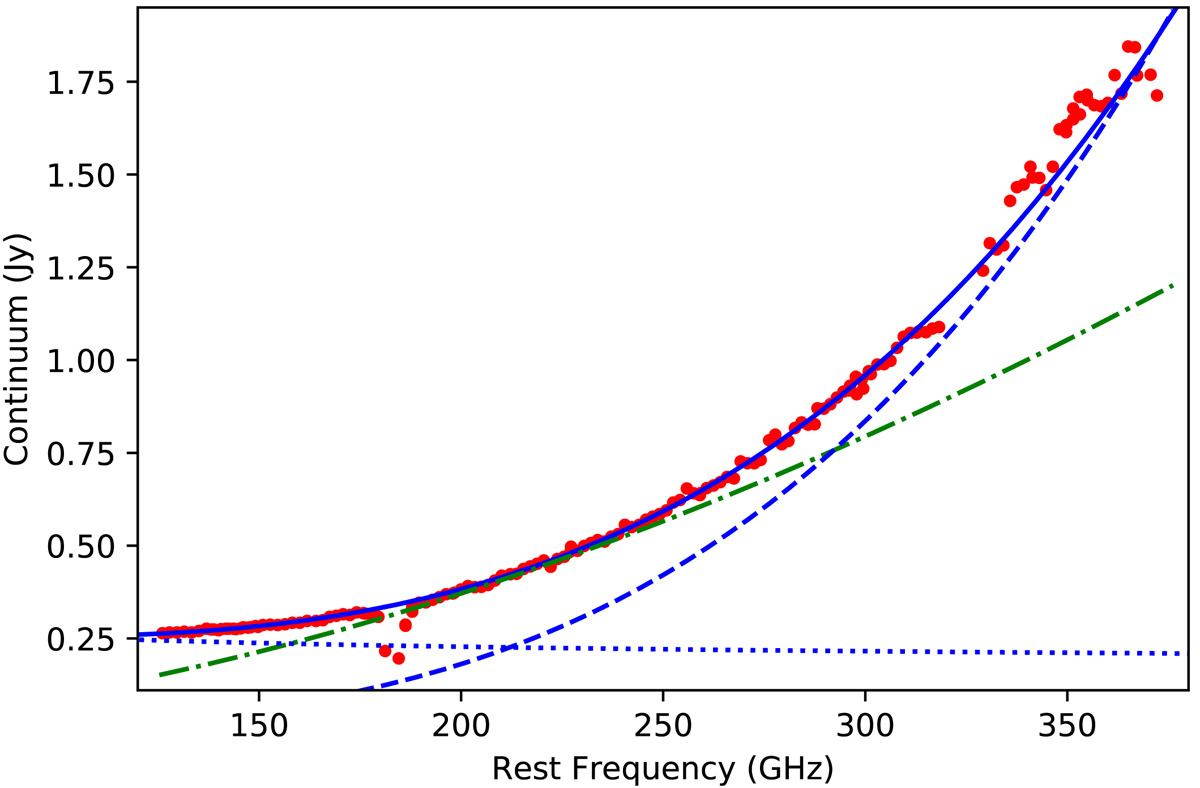
Continuum flux density at the peak of emission as derived from each spectral window across the surveyed frequency range (red dots). We note that extended emission in our data might account for up to ∼20% higher fluxes (Sect. 4.1). A fit to the data is shown by a continuous blue line, which is the combination of the free-free emission (dotted blue almost horizontal line) and the graybody emission (dashed blue line). See text for further details on parameters used. As a reference to illustrate the deviation from pure black body emission, that for a Td = 50 K and 0.5″ source size is shown as a green dot-dashed line.
Current usage metrics show cumulative count of Article Views (full-text article views including HTML views, PDF and ePub downloads, according to the available data) and Abstracts Views on Vision4Press platform.
Data correspond to usage on the plateform after 2015. The current usage metrics is available 48-96 hours after online publication and is updated daily on week days.
Initial download of the metrics may take a while.