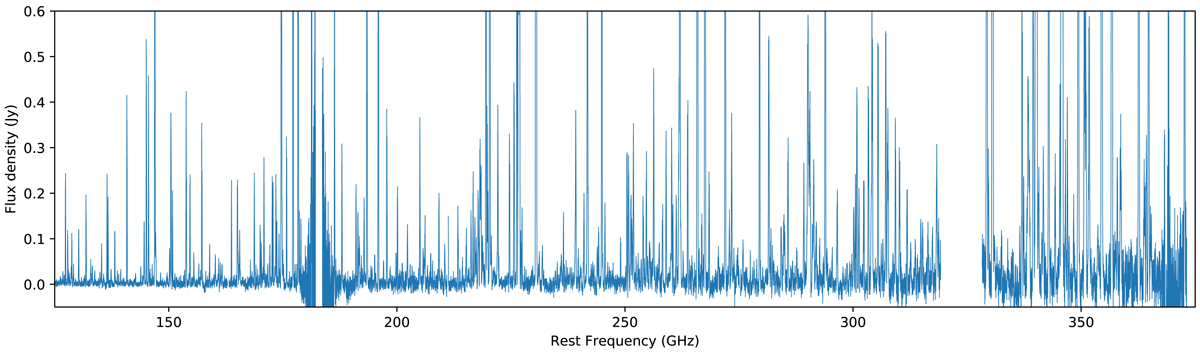
Fig. 4.
Download original image
Full spectral coverage obtained with the ALMA Compact Array (ACA 7m) alone, extracted from the position of brightest molecular emission (see Sect. 4.3.1). Figure F.1 presents a zoomed version of this plot in five frequency windows 50 GHz wide where the comparison with the modeled emission (Sect. 4.3.2) and the molecular line identification of each individual feature is included. Figures F.2–F.11 present a further zoomed version in 5 GHz windows.
Current usage metrics show cumulative count of Article Views (full-text article views including HTML views, PDF and ePub downloads, according to the available data) and Abstracts Views on Vision4Press platform.
Data correspond to usage on the plateform after 2015. The current usage metrics is available 48-96 hours after online publication and is updated daily on week days.
Initial download of the metrics may take a while.