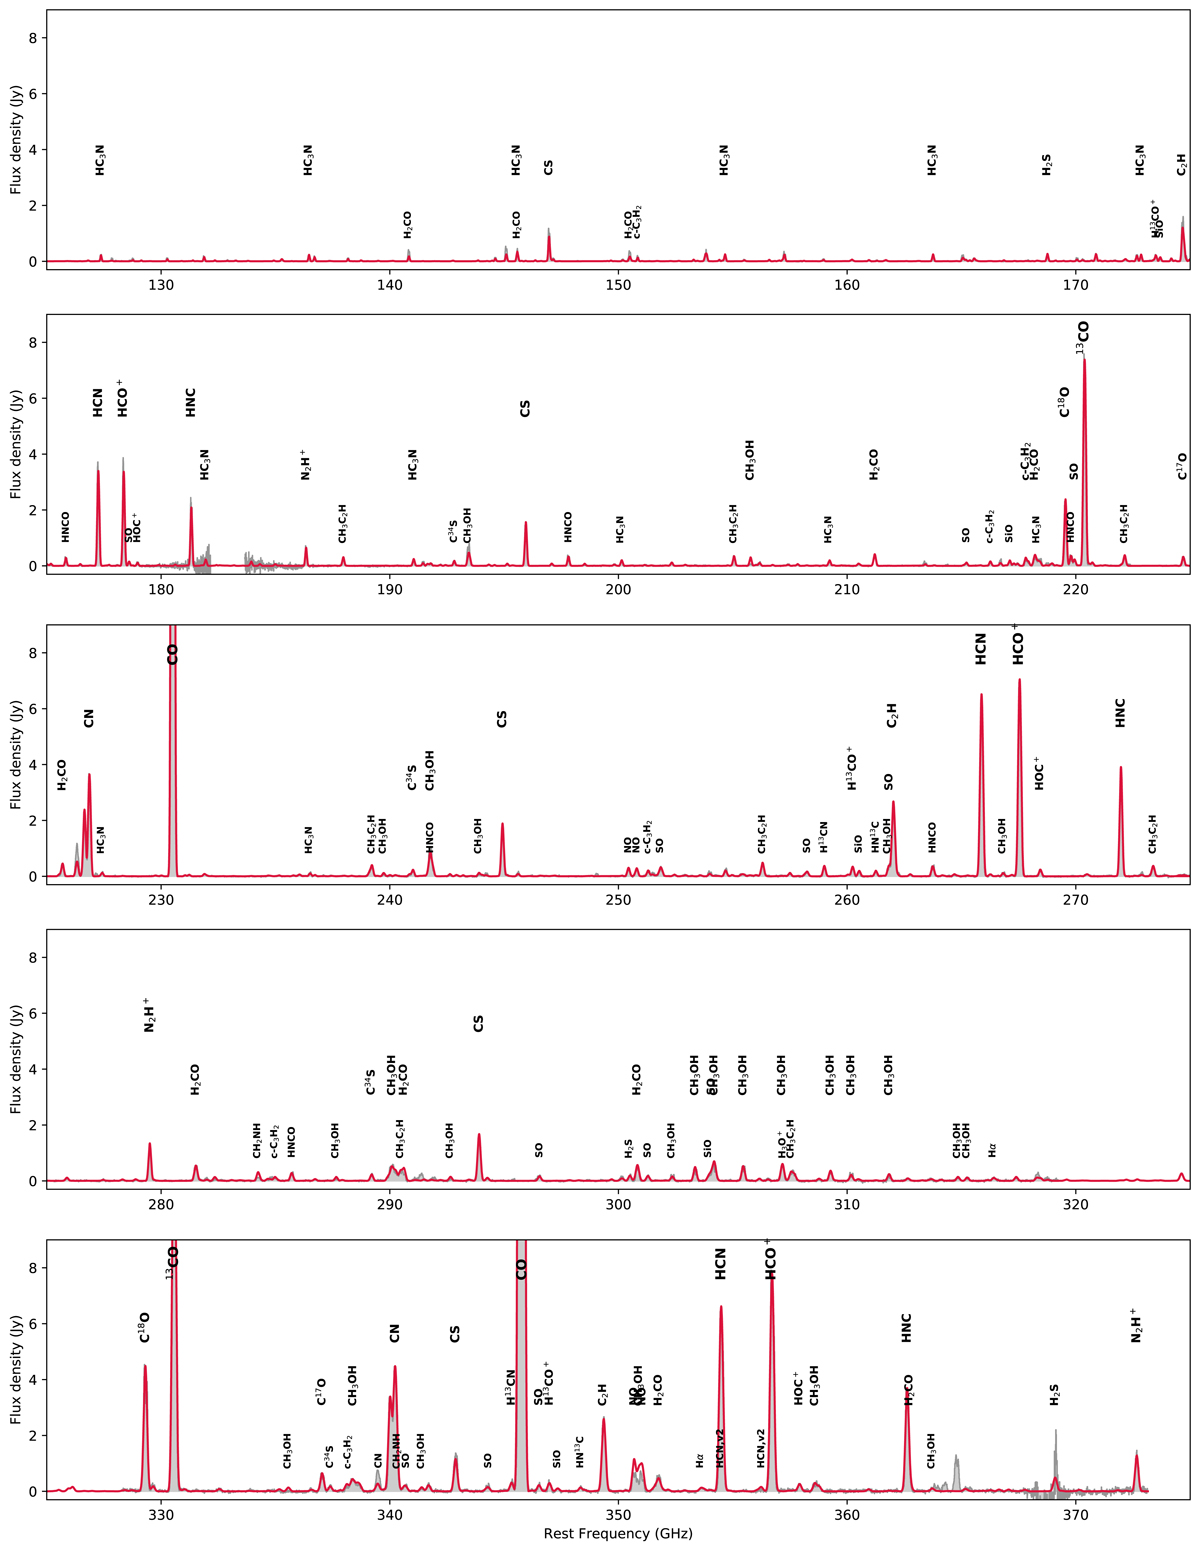
Fig. F.1.
Download original image
Full spectral coverage as in Fig.4 zoomed to 50 GHz frequency windows. The observed spectrum is shown in grey histogram and the model (Sect. 4.3.2) in red line. Only the brighter individual molecular transitions with intensities higher than 100 mJy are labeled with different y-axis position and character size depending on the modelled intensity for > 5, > 1,> 0.2, and > 0.1 Jy.
Current usage metrics show cumulative count of Article Views (full-text article views including HTML views, PDF and ePub downloads, according to the available data) and Abstracts Views on Vision4Press platform.
Data correspond to usage on the plateform after 2015. The current usage metrics is available 48-96 hours after online publication and is updated daily on week days.
Initial download of the metrics may take a while.