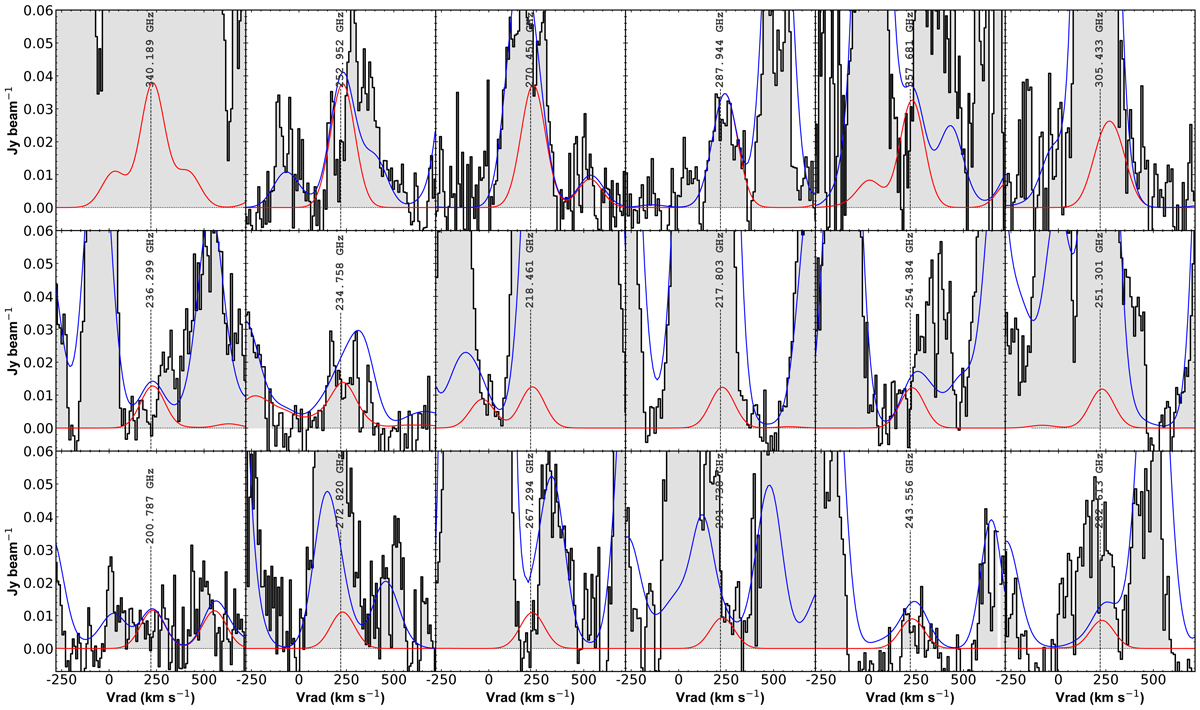
Fig. D.1.
Download original image
Modeled emission of C2H5OH in red, overlaid over the observed spectrum (filled black histogram) and the global model including all molecular transitions in this study. Only the 18 brightest transitions or group of transitions according to the LTE model of C2H5OH are displayed, ordered in descending order of brightness from left to right and top to bottom. The model generated with MADCUBA makes use of the spectroscopic parameters in JPL catalog entry 46004. The frequency of the brightest transition in each panel are displayed for reference.
Current usage metrics show cumulative count of Article Views (full-text article views including HTML views, PDF and ePub downloads, according to the available data) and Abstracts Views on Vision4Press platform.
Data correspond to usage on the plateform after 2015. The current usage metrics is available 48-96 hours after online publication and is updated daily on week days.
Initial download of the metrics may take a while.