Fig. 2.
Download original image
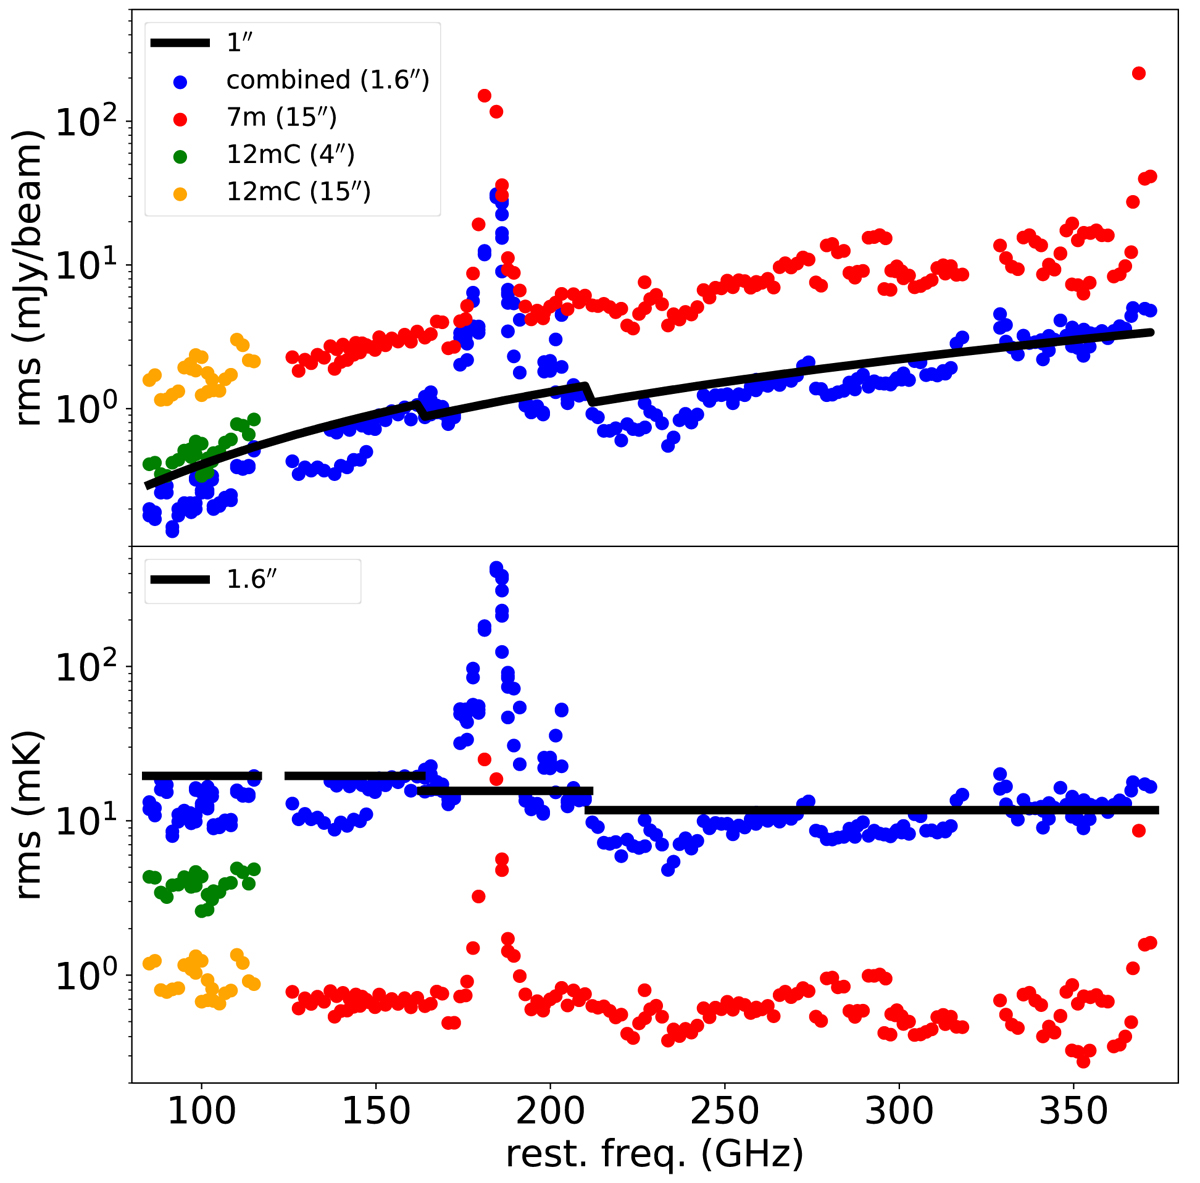
Measured RMS flux density (top) and equivalent brightness temperature (bottom) noise level of each individual data cube (spectral windows) imaged for the combined arrays (blue), compact 12 m array band 3 observations (green) and 7 m array band 4 to 7 (red). Black lines correspond to the target sensitivities requested for 1″ (top) and ![]() (bottom) resolution imaging. Brightness temperature noise levels have been calculated for a beam of 1.6″, 4″, and 15″ for combined, 12 m compact, and 7 m array, respectively. For completeness, compact 12 m array band 3 sensitivities are also displayed (orange) for data cubes imaged at 7 m array 15″ resolution. Target brightness temperature sensitivities are scaled down to that of the common beam of 1.6″ resolution used during imaging. See Sects. 2.2 and 3.2 for details.
(bottom) resolution imaging. Brightness temperature noise levels have been calculated for a beam of 1.6″, 4″, and 15″ for combined, 12 m compact, and 7 m array, respectively. For completeness, compact 12 m array band 3 sensitivities are also displayed (orange) for data cubes imaged at 7 m array 15″ resolution. Target brightness temperature sensitivities are scaled down to that of the common beam of 1.6″ resolution used during imaging. See Sects. 2.2 and 3.2 for details.
Current usage metrics show cumulative count of Article Views (full-text article views including HTML views, PDF and ePub downloads, according to the available data) and Abstracts Views on Vision4Press platform.
Data correspond to usage on the plateform after 2015. The current usage metrics is available 48-96 hours after online publication and is updated daily on week days.
Initial download of the metrics may take a while.