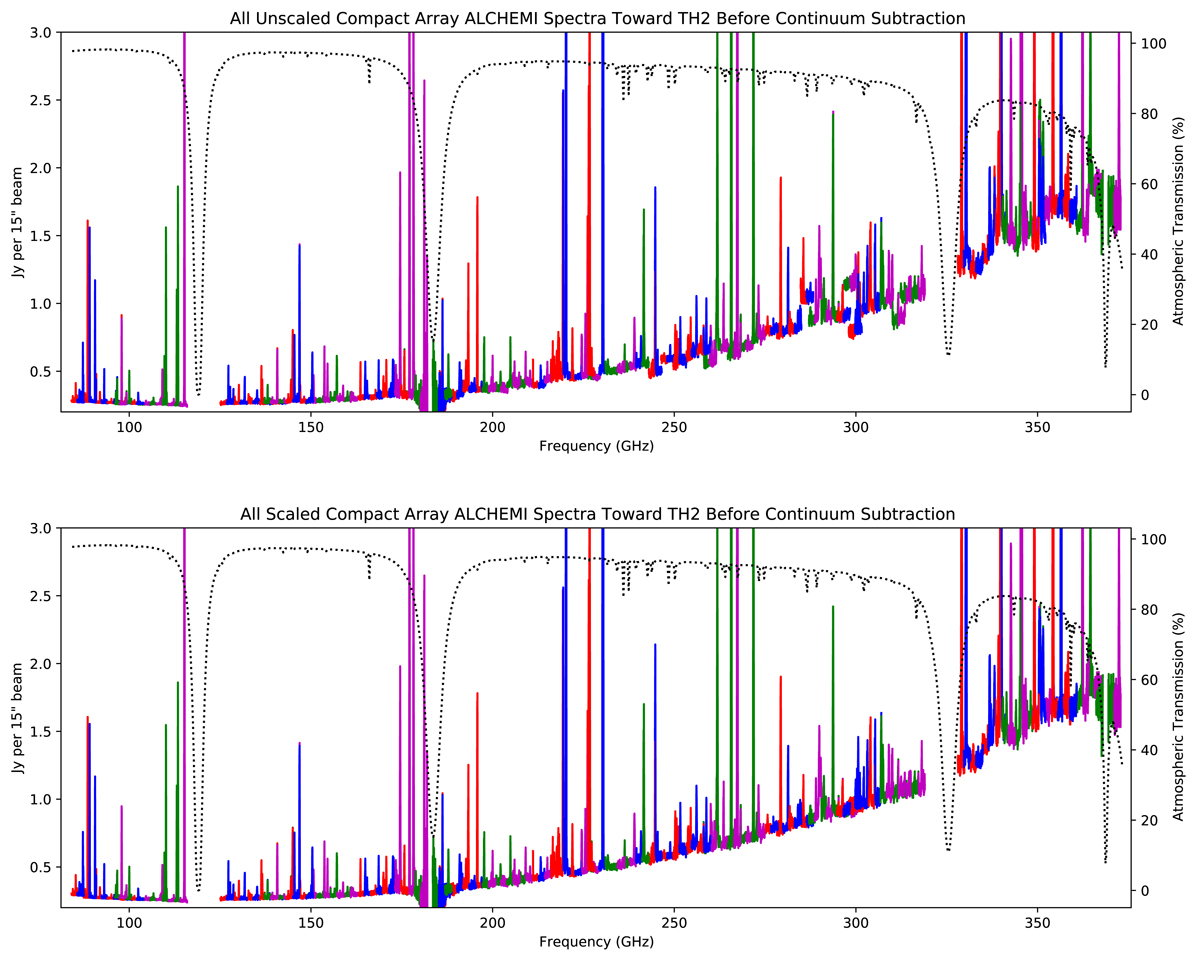
Fig. B.1.
Download original image
Unscaled (top) and scaled (bottom) full spectral scans. The spectra were extracted from the TH2 position in the low resolution data (see Sect. B). The colors in the spectra represent the spectral windows from the lower side band (red and blue) and the upper side band (green and violet). A dotted line indicates the atmospheric transmission for a PWV of 1 mm.
Current usage metrics show cumulative count of Article Views (full-text article views including HTML views, PDF and ePub downloads, according to the available data) and Abstracts Views on Vision4Press platform.
Data correspond to usage on the plateform after 2015. The current usage metrics is available 48-96 hours after online publication and is updated daily on week days.
Initial download of the metrics may take a while.