Fig. 16.

Download original image
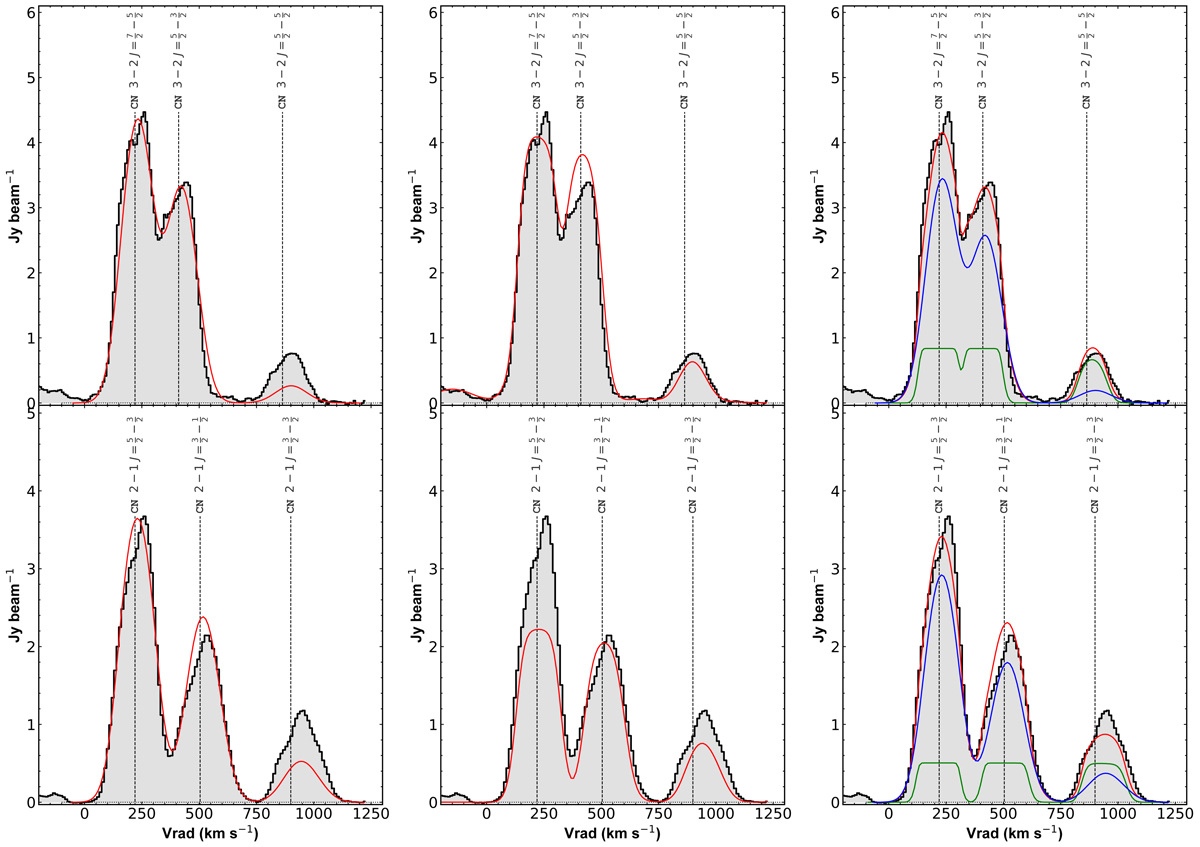
CN N = 3 − 2 (top) and N = 2 − 1 (bottom) emission measured with the ACA data presented in this article. Panels are centered at 340.248 and 226.874 GHz, which is the frequency of the stronger emission hyperfine transition. The data are fitted with three simple models. Left: single component corresponding to the fit presented in Sect. 4.3.2, where a source size θs = 5″ is assumed. The central opacity of the brightest transitions are τ3 − 2 = 0.25 and τ2 − 1 = 0.44, while the cumulative opacity of the stronger hyperfine groups are ![]() and
and ![]() . See text in Sect. 5.5 for details. Center: single component fit assuming a smaller source size of θs = 2.5″. Physical parameters of the fit are log(N) = 16.43 cm−2, T = 13.4 K, vlsr = 229 km s−1, δv1/2 = 118 km s−1. Opacity of brighter transitions are τ3 − 2 = 1.6 and τ2 − 1 = 2.1, and group opacities
. See text in Sect. 5.5 for details. Center: single component fit assuming a smaller source size of θs = 2.5″. Physical parameters of the fit are log(N) = 16.43 cm−2, T = 13.4 K, vlsr = 229 km s−1, δv1/2 = 118 km s−1. Opacity of brighter transitions are τ3 − 2 = 1.6 and τ2 − 1 = 2.1, and group opacities ![]() and
and ![]() . Right: two component model assuming two sources of sizes θs = 5″/1.5″. Physical parameters of models are log(N) = 15.6/17.3 cm−2, T = 10.2/10.0 K, vlsr = 232/220 km s−1, δv1/2 = 150/76 km s−1. Opacity of brighter transitions are τ3 − 2 = 0.18 and τ2 − 1 = 0.31 for the first component, while the thick component is completely saturated. Blue and green lines represent the two components, respectively, with sum of both models is represented by the red line.
. Right: two component model assuming two sources of sizes θs = 5″/1.5″. Physical parameters of models are log(N) = 15.6/17.3 cm−2, T = 10.2/10.0 K, vlsr = 232/220 km s−1, δv1/2 = 150/76 km s−1. Opacity of brighter transitions are τ3 − 2 = 0.18 and τ2 − 1 = 0.31 for the first component, while the thick component is completely saturated. Blue and green lines represent the two components, respectively, with sum of both models is represented by the red line.
Current usage metrics show cumulative count of Article Views (full-text article views including HTML views, PDF and ePub downloads, according to the available data) and Abstracts Views on Vision4Press platform.
Data correspond to usage on the plateform after 2015. The current usage metrics is available 48-96 hours after online publication and is updated daily on week days.
Initial download of the metrics may take a while.


