Fig. 14.
Download original image
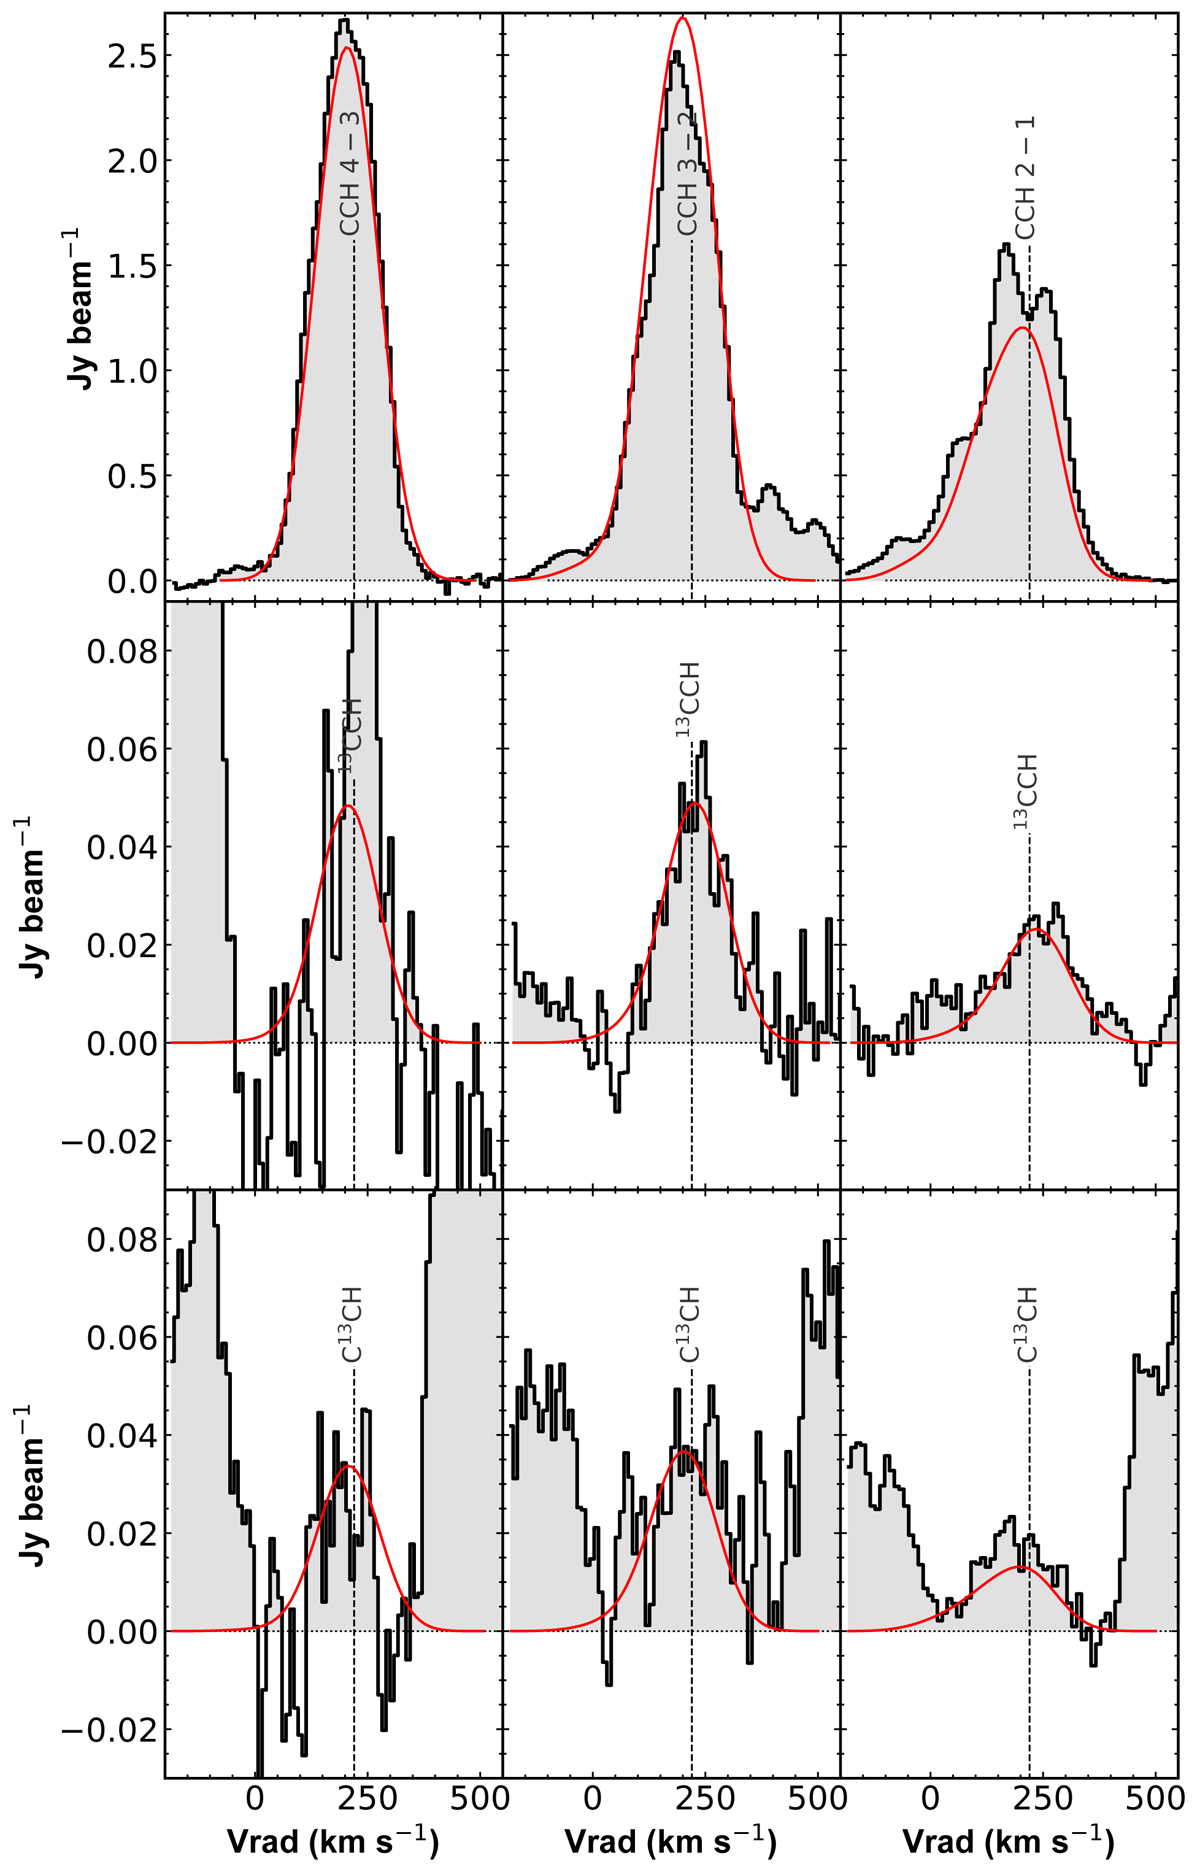
Spectral features of the J = 4 − 3 (left), 3 − 2 (center) and 2 − 1 (right) transitions from three of the isotopologues of CCH detected in the survey. Red curves shows the LTE model best fits. Contributions by other species is almost negligible for most transitions according to the global LTE model from the full survey (see Sect. 4.3.2). However we note that the observed profile of 13CCH 4−3, not following the CCH LTE model and not accounted for by emission from other species, was not used in the fit.
Current usage metrics show cumulative count of Article Views (full-text article views including HTML views, PDF and ePub downloads, according to the available data) and Abstracts Views on Vision4Press platform.
Data correspond to usage on the plateform after 2015. The current usage metrics is available 48-96 hours after online publication and is updated daily on week days.
Initial download of the metrics may take a while.