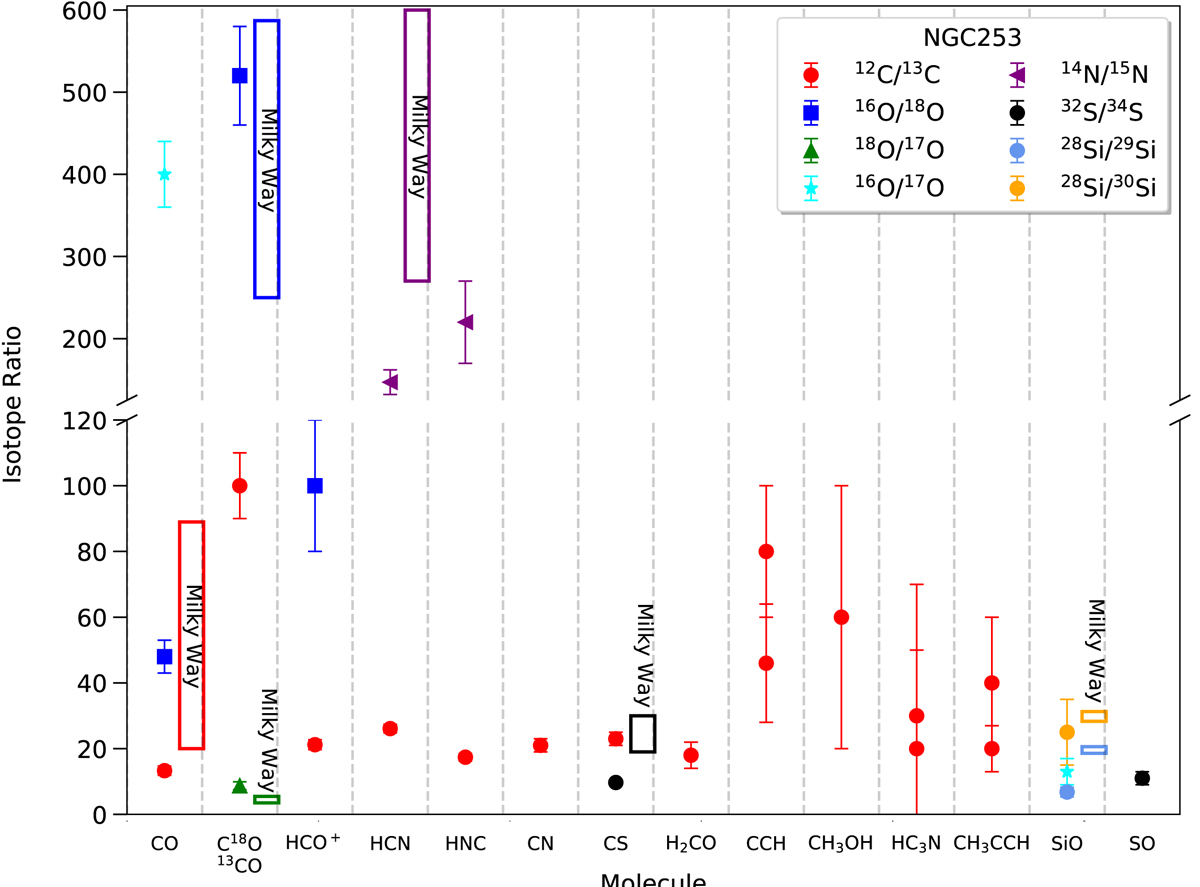
Fig. 13.
Download original image
Measured NGC 253 isotope ratios in the ACA data (Table 4) compared to their equivalent values in the Milky Way (Wilson 1999). The horizontal axis indicates the molecular species, or in the case of CO the isotopomer, used to measure a given isotope ratio. Colored rectangles are used to indicate Milky Way isotope ratio value ranges. As no uncertainties nor range of values was provided for the Si isotope ratios, a range of 10% of the estimated values was assumed. As the Milky Way 16O/17O value would be ≳875, we have opted to not show this Milky Way isotope ratio value.
Current usage metrics show cumulative count of Article Views (full-text article views including HTML views, PDF and ePub downloads, according to the available data) and Abstracts Views on Vision4Press platform.
Data correspond to usage on the plateform after 2015. The current usage metrics is available 48-96 hours after online publication and is updated daily on week days.
Initial download of the metrics may take a while.