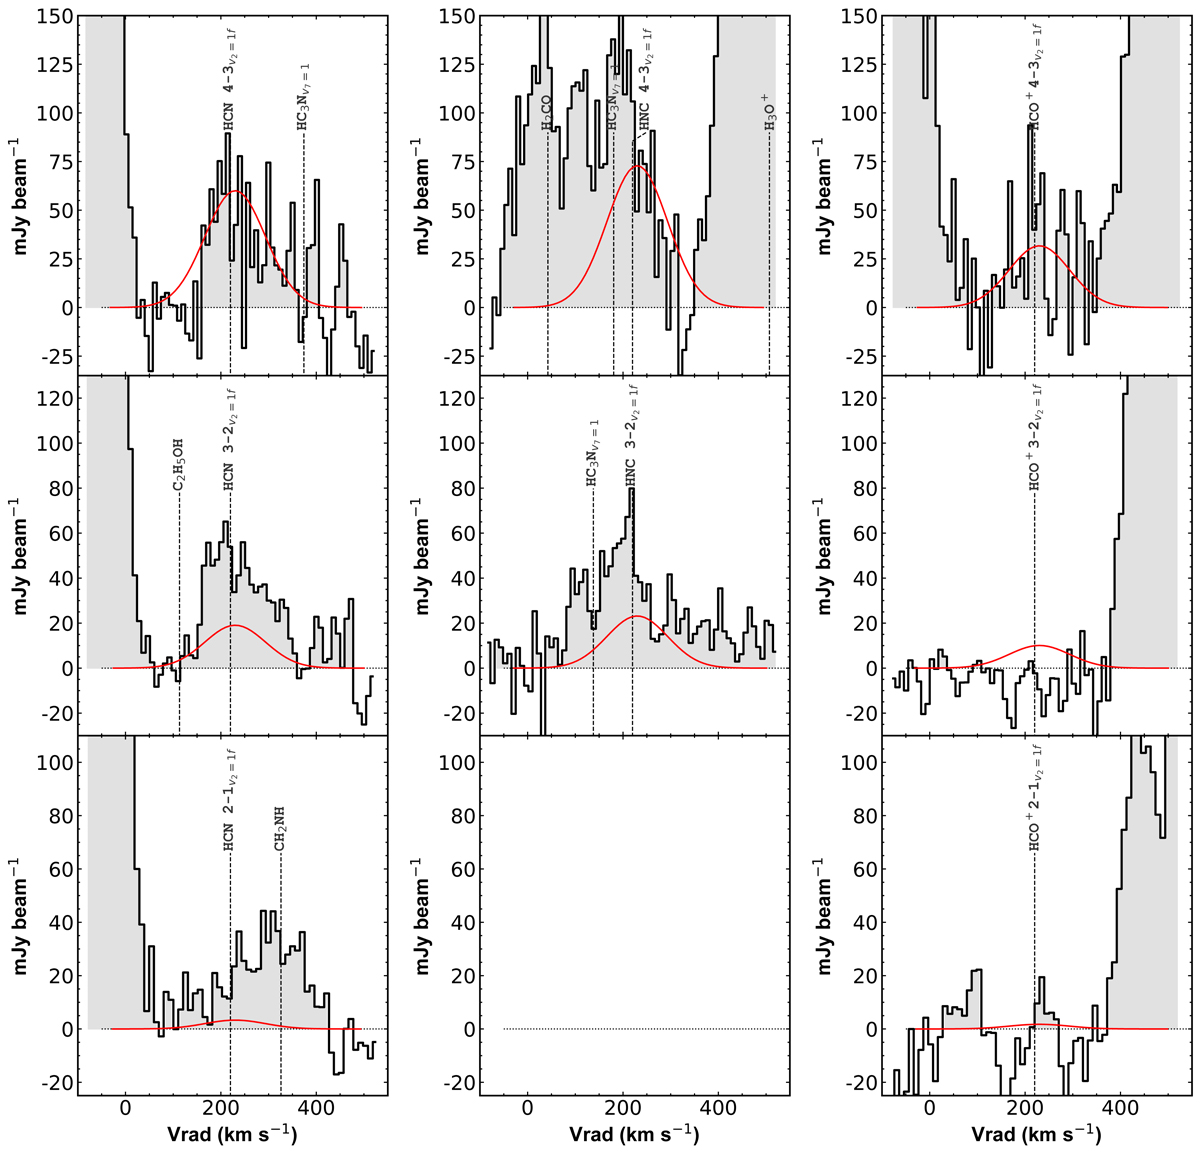
Fig. 11.
Download original image
Rotational transitions in the vibrational state v2 = 1f of HCN, HNC and HCO+ covered within the surveyed frequency range. The box corresponding to HNC 2 − 1 v2 = 1f was left intentionally blank since its emission at 182.6 GHz falls within the telluric water transition observation gap (Sect. 2). Red lines show an attempt to fit the observed emission under LTE assuming Tex = 300 K (see text in Sect. 5.2 for details). Nearby transitions from detected species with modeled flux densities > 10% of that of the vibrational transitions are labeled.
Current usage metrics show cumulative count of Article Views (full-text article views including HTML views, PDF and ePub downloads, according to the available data) and Abstracts Views on Vision4Press platform.
Data correspond to usage on the plateform after 2015. The current usage metrics is available 48-96 hours after online publication and is updated daily on week days.
Initial download of the metrics may take a while.