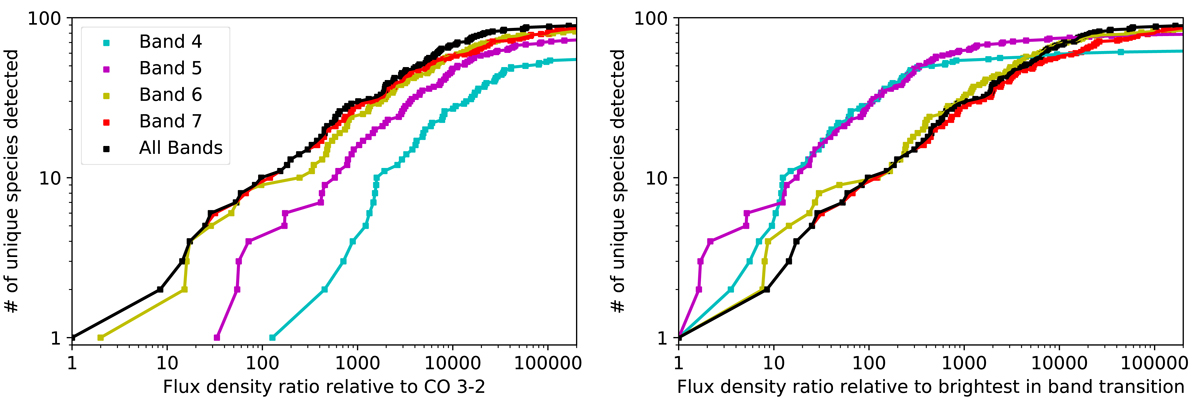
Fig. 10.
Download original image
Number of individual detectable species as a function of the flux density level relative to the brighter transitions detected in the survey per band. Left: flux density levels are referred to the CO 3 − 2 (112 Jy beam−1) as the brightest transition detected in the whole spectral range covered. Right: flux densities are referred to the brightest transition detected on each band. This is CS 3 − 2 (0.9 Jy beam−1 in Band 4), HCO+ 2 − 1 (3 Jy beam−1 in Band 5), CO 2 − 1 (56 Jy beam−1 in Band 6), and CO 3 − 2 (in Band 7).
Current usage metrics show cumulative count of Article Views (full-text article views including HTML views, PDF and ePub downloads, according to the available data) and Abstracts Views on Vision4Press platform.
Data correspond to usage on the plateform after 2015. The current usage metrics is available 48-96 hours after online publication and is updated daily on week days.
Initial download of the metrics may take a while.