Fig. 1.
Download original image
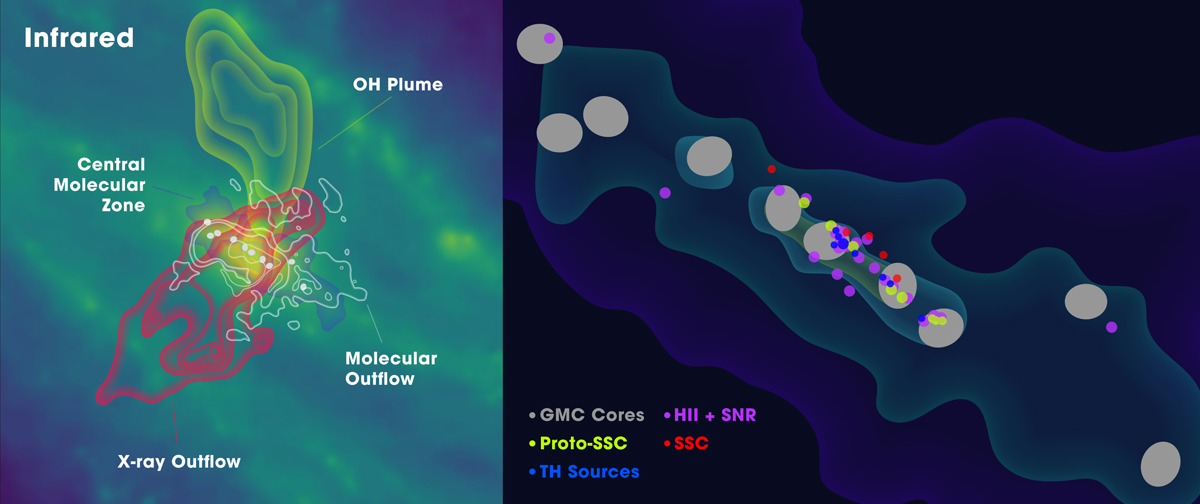
Schematic summary of the activity within central molecular zone of NGC 253. See Sect. 1 for a comprehensive summary of the activity in its central region as probed by multiwavelength observations. In both figures, the CO traced CMZ, and the dense gas traced GMCs (Leroy et al. 2015) are included as a spatial scale reference. Left: IRAC 8μm from Spitzer Local Volume Legacy survey (Dale et al. 2009) in the background; Chandra X-ray traced outflow (Strickland et al. 2000); 18 cm OH plume (Turner 1985); molecular outflow observed in CO emission (Bolatto et al. 2013). Right: 2 cm TH sources (Turner & Ho 1985) and HII regions and supernovae remnants (Ulvestad & Antonucci 1997); proto-super stellar clusters traced by vibrationally excited HC3N emission (Rico-Villas et al. 2020); star cluster identified from near-IR HST imaging (Watson et al. 1996).
Current usage metrics show cumulative count of Article Views (full-text article views including HTML views, PDF and ePub downloads, according to the available data) and Abstracts Views on Vision4Press platform.
Data correspond to usage on the plateform after 2015. The current usage metrics is available 48-96 hours after online publication and is updated daily on week days.
Initial download of the metrics may take a while.