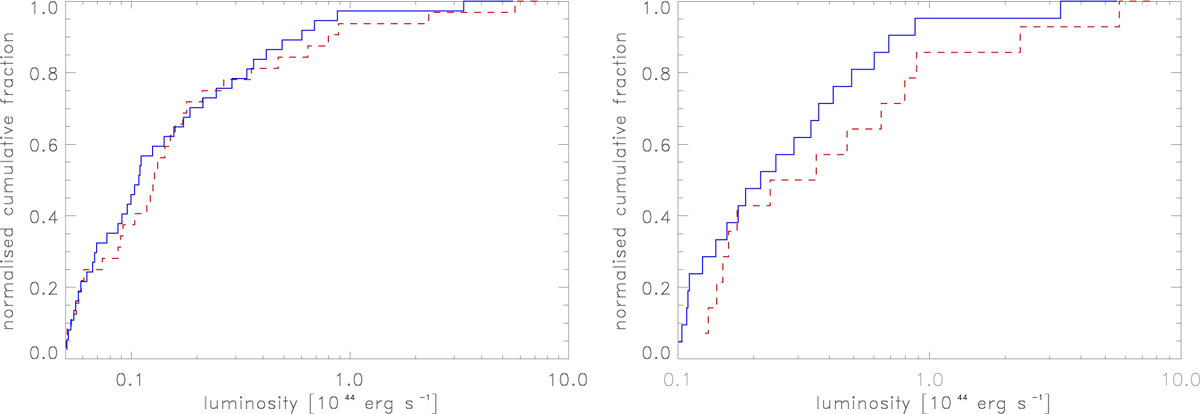
Fig. 17.
Download original image
Cumulative normalised X-ray luminosity distribution of clusters in the eight superclusters (red dashed line) compared to the distribution for clusters in the field (blue solid line) with a lower X-ray luminosity limit of 0.5 × 1043 erg s−1. The data in the left panel include all eight superclusters, those in the right panel only the four large superclusters.
Current usage metrics show cumulative count of Article Views (full-text article views including HTML views, PDF and ePub downloads, according to the available data) and Abstracts Views on Vision4Press platform.
Data correspond to usage on the plateform after 2015. The current usage metrics is available 48-96 hours after online publication and is updated daily on week days.
Initial download of the metrics may take a while.