Fig. 2.
Download original image
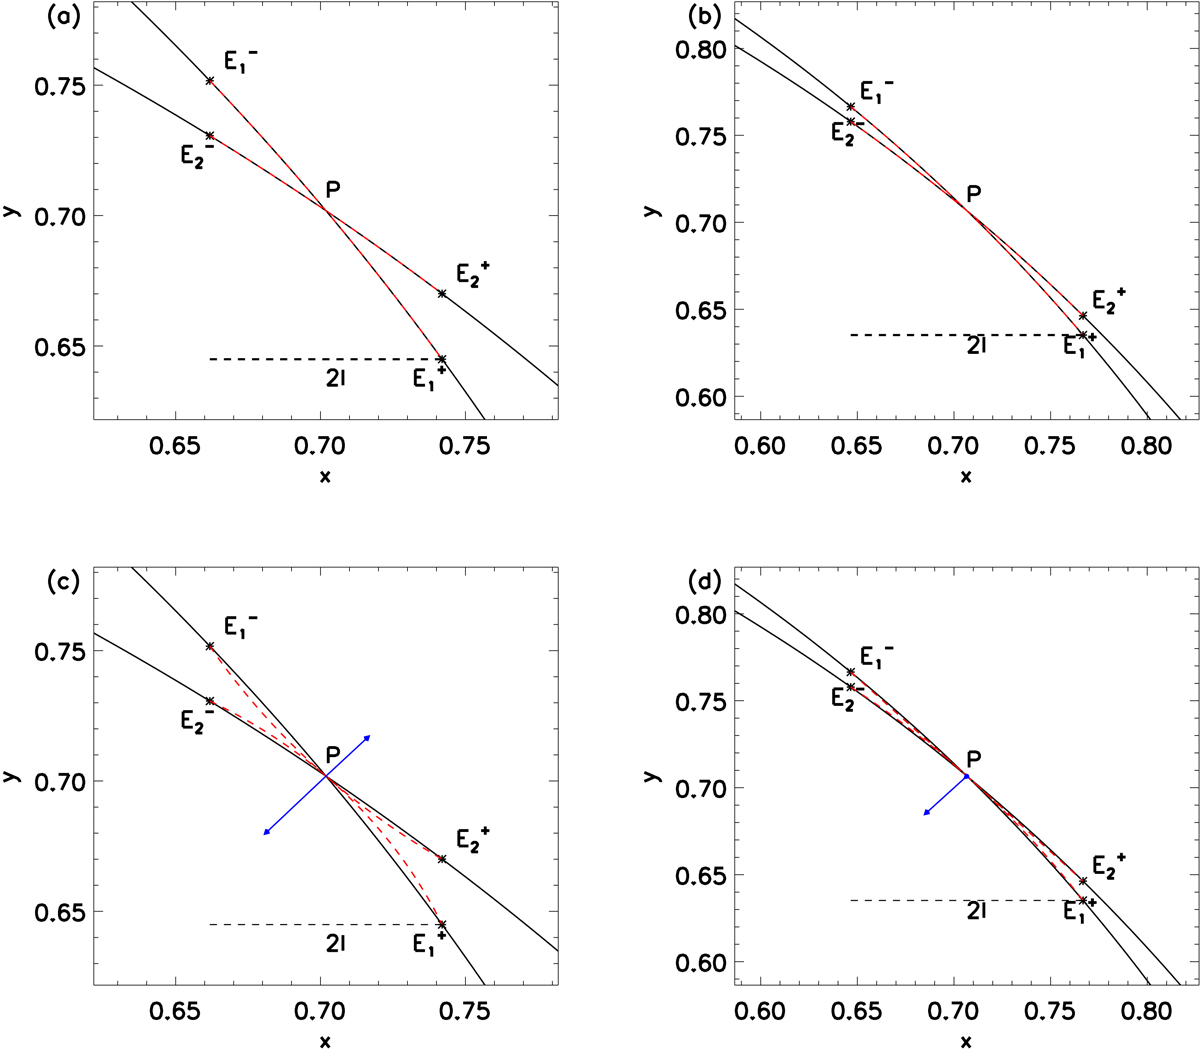
Zoomed-in view of the profiles of intersecting magnetic field lines at θ = 13° (panels a and c) and at θ = 3.7° (b and d). Panels a and b: configuration before the magnetic reconnection, where the connectivity (dashed red arcs) connect (![]() , P,
, P, ![]() ) and (
) and (![]() , P,
, P, ![]() ). Panels c and d: configuration after the magnetic reconnection, where the connectivity changed (dashed red arcs) and the connected points are (
). Panels c and d: configuration after the magnetic reconnection, where the connectivity changed (dashed red arcs) and the connected points are (![]() , P,
, P, ![]() ) and (
) and (![]() , P,
, P, ![]() ). In panels c and d the length of the blue arrows is proportional to the inverse of the curvature radius of the dashed red arcs (defined by the circles passing through those points), and their directions point towards their centres of curvature.
). In panels c and d the length of the blue arrows is proportional to the inverse of the curvature radius of the dashed red arcs (defined by the circles passing through those points), and their directions point towards their centres of curvature.
Current usage metrics show cumulative count of Article Views (full-text article views including HTML views, PDF and ePub downloads, according to the available data) and Abstracts Views on Vision4Press platform.
Data correspond to usage on the plateform after 2015. The current usage metrics is available 48-96 hours after online publication and is updated daily on week days.
Initial download of the metrics may take a while.