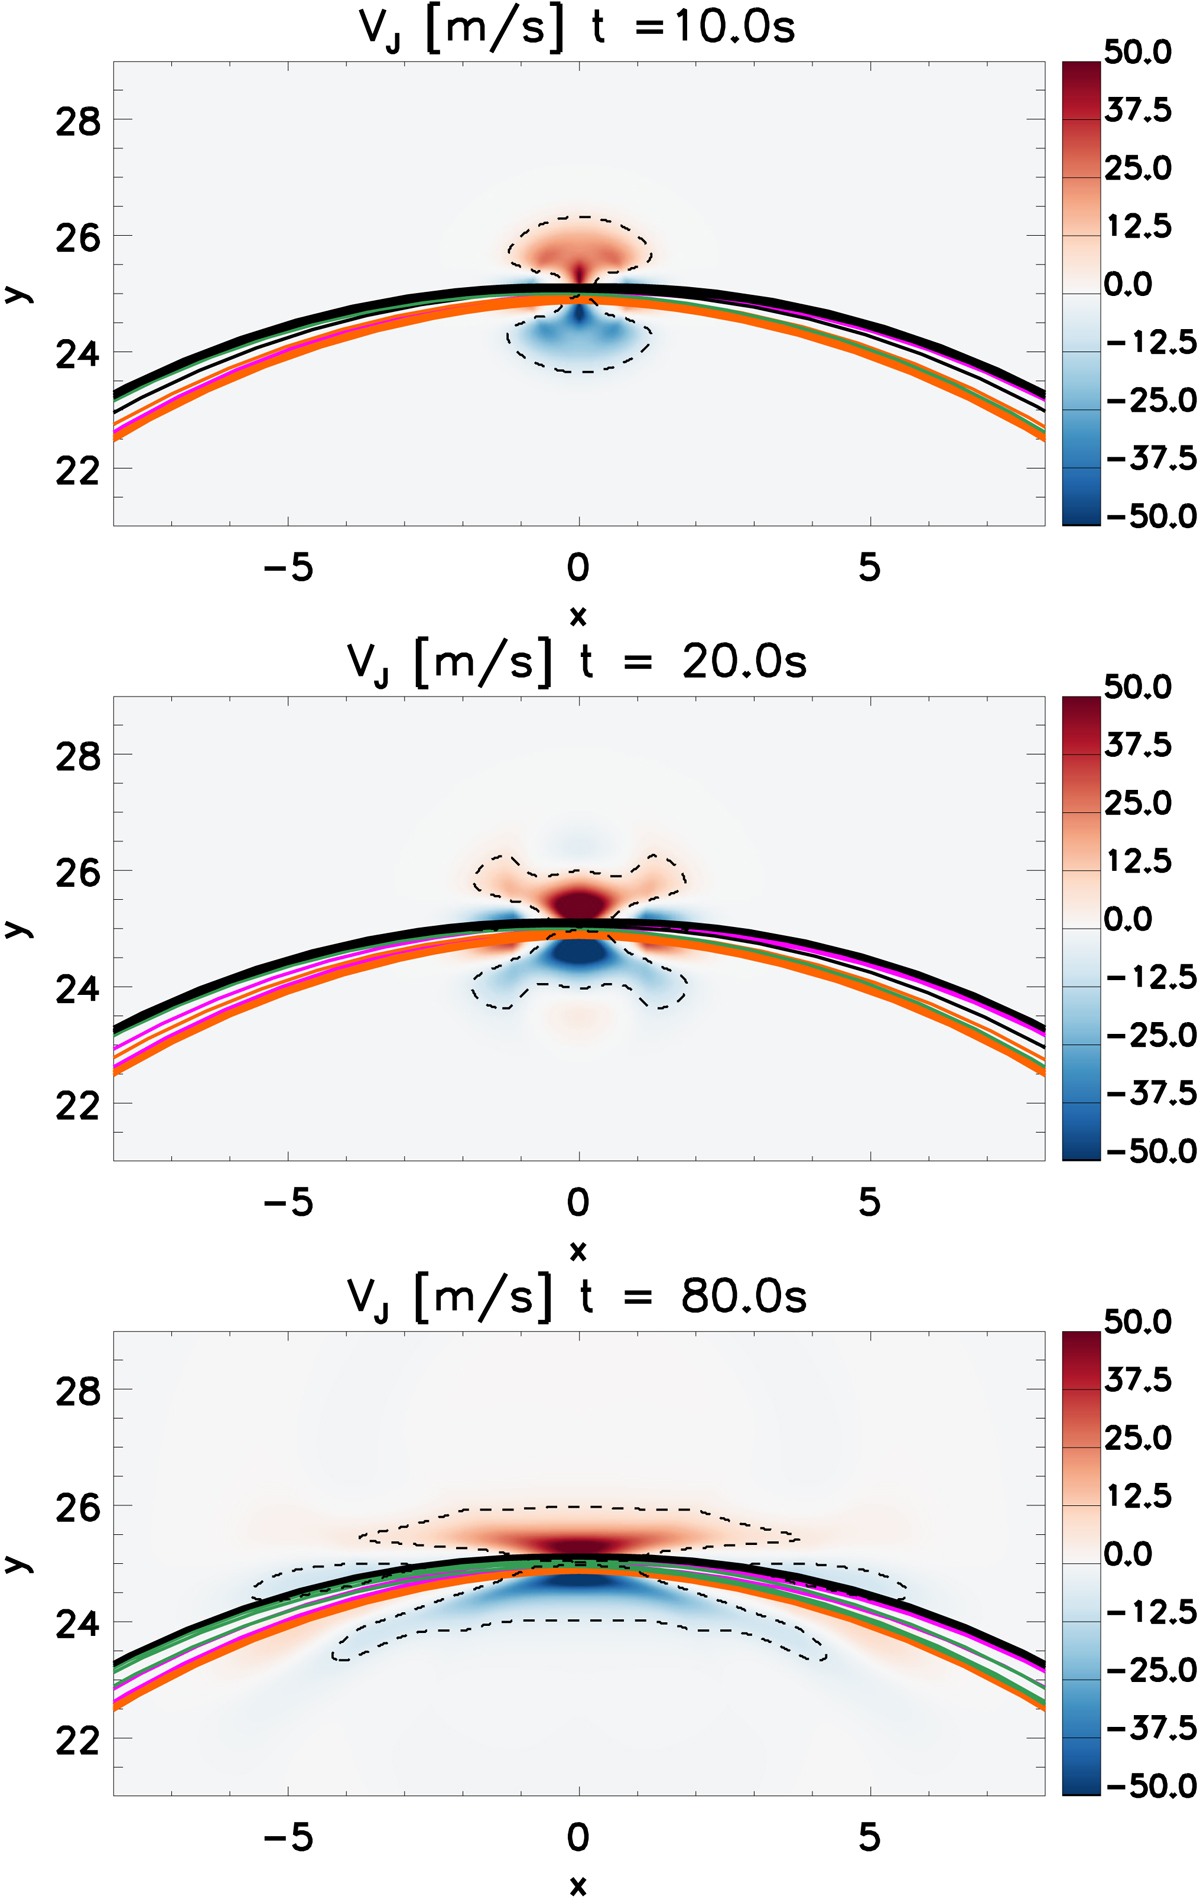
Fig. 12.
Download original image
Maps of the velocity of the jets, VJ, defined as the projection of the radial velocity onto the direction perpendicular to the magnetic field at three different times in the simulation with xc = 0.5 Mm and L∥ = 0.5 Mm on the z = 0 plane. In all panels some representative field lines are superimposed. Dashed black contours show the region where the jet speed is above 5 m s−1; it is positive for the region above yJ and negative for the region below yJ.
Current usage metrics show cumulative count of Article Views (full-text article views including HTML views, PDF and ePub downloads, according to the available data) and Abstracts Views on Vision4Press platform.
Data correspond to usage on the plateform after 2015. The current usage metrics is available 48-96 hours after online publication and is updated daily on week days.
Initial download of the metrics may take a while.