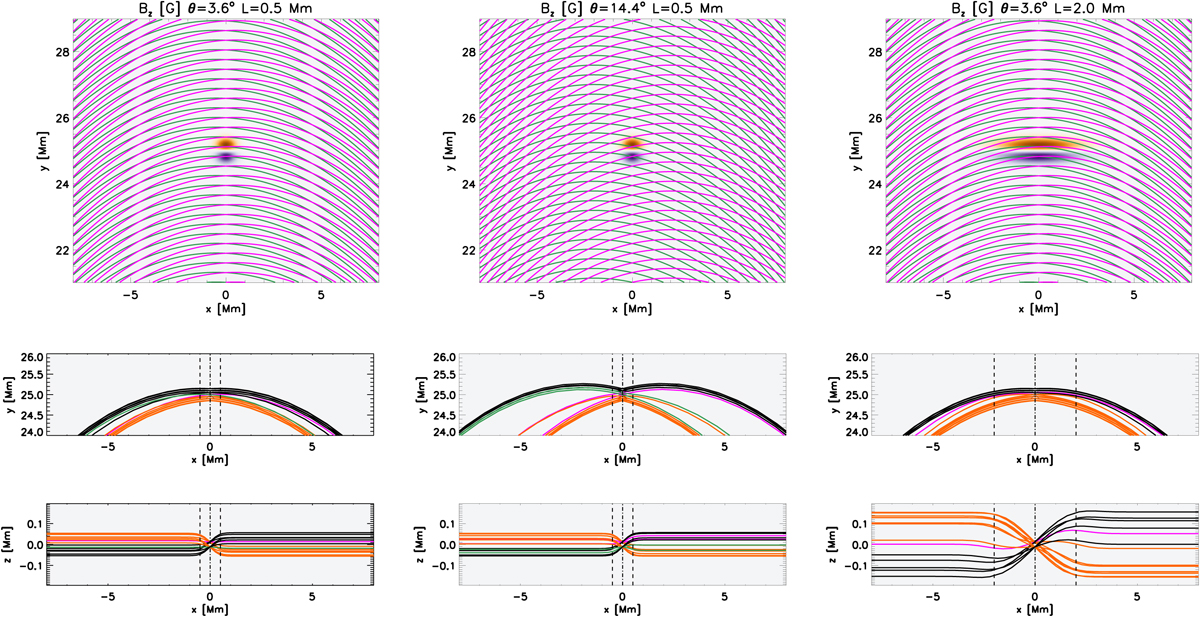
Fig. 10.
Download original image
Upper row: maps of Bz in the initial conditions of our simulations with superimposed magnetic field lines (green for z < 0 and magenta for z > 0), where we set xc = 0.5 Mm and L∥ = 0.5 Mm (left-hand column), xc = 2.0 Mm and L∥ = 0.5 Mm (central column), and xc = 0.5 Mm and L∥ = 2.0 Mm (right-hand column) on the plane z = 0. Two lower rows: some representative magnetic field lines projected onto the x − y plane and x − z planes. Magnetic field lines are coloured black and orange if they cross the z = 0 plane, and magenta and green if they do not.
Current usage metrics show cumulative count of Article Views (full-text article views including HTML views, PDF and ePub downloads, according to the available data) and Abstracts Views on Vision4Press platform.
Data correspond to usage on the plateform after 2015. The current usage metrics is available 48-96 hours after online publication and is updated daily on week days.
Initial download of the metrics may take a while.