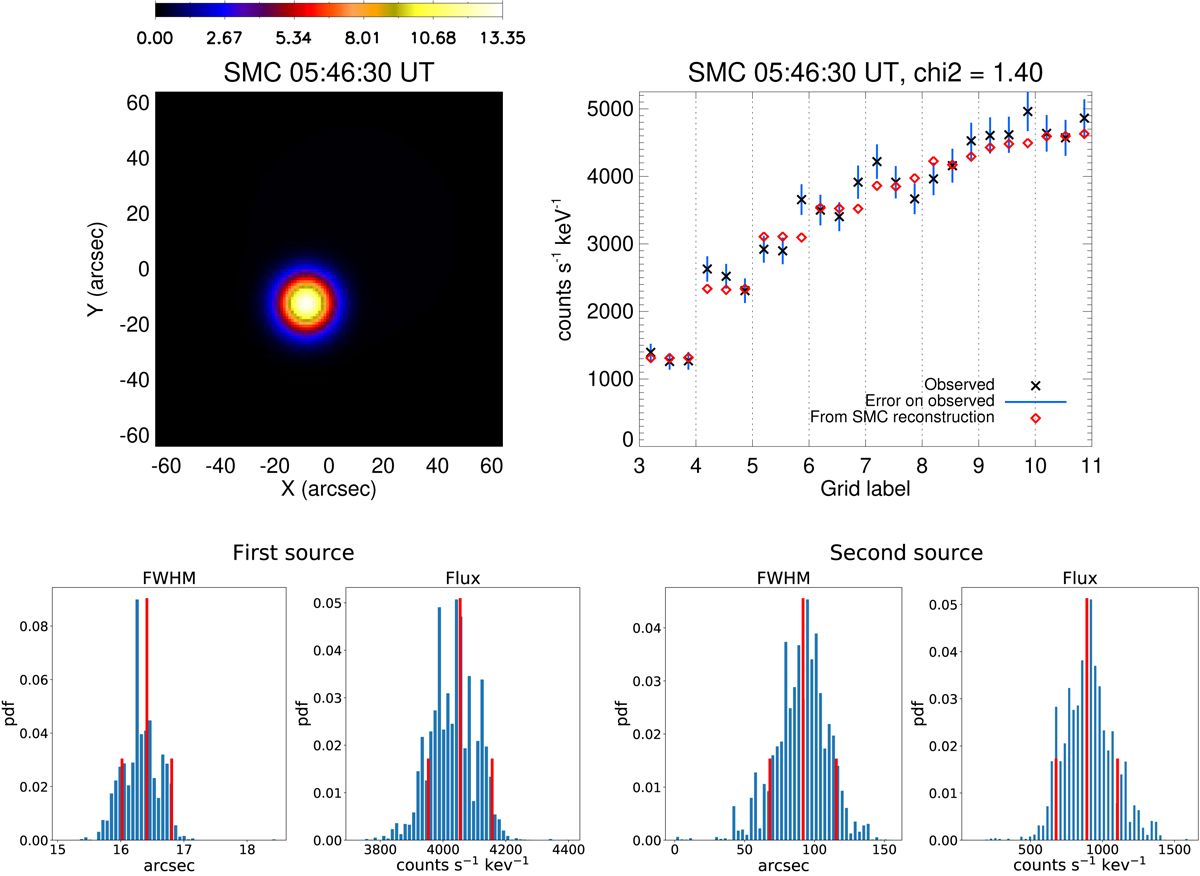
Fig. 8.
Download original image
SMC reconstruction from the visibility amplitudes observed by STIX at 05:46:30 UT on November 18, 2020, with one second integration time in the energy channel 7–12 keV. Top left: flaring source modeled by means of a double-Gaussian input configuration. Top right: corresponding data fit. Bottom: histograms for the FWHM and flux probability distributions for the two sources. In red, we show the mean and standard deviations of the posterior distributions (used to give point estimates).
Current usage metrics show cumulative count of Article Views (full-text article views including HTML views, PDF and ePub downloads, according to the available data) and Abstracts Views on Vision4Press platform.
Data correspond to usage on the plateform after 2015. The current usage metrics is available 48-96 hours after online publication and is updated daily on week days.
Initial download of the metrics may take a while.