Free Access
Fig. 7.
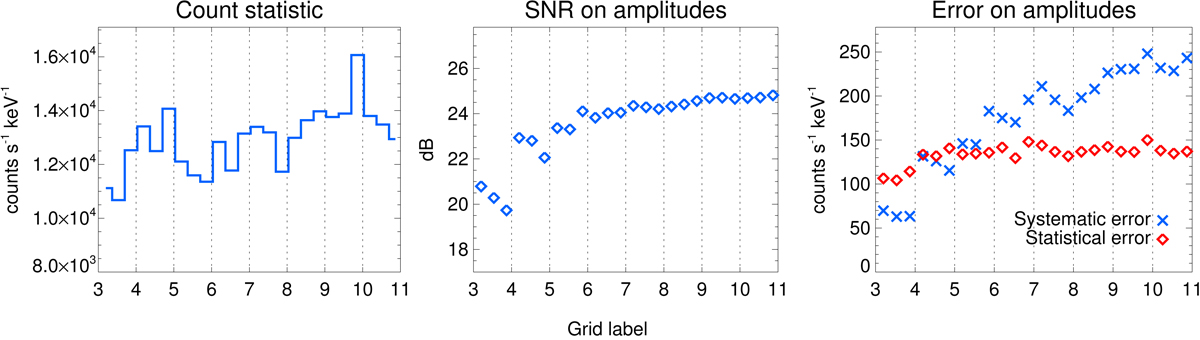
Download original image
STIX observation for one second integration time, starting from 05:46:30 UT, in the energy channel 7–12 keV. Left panel: count statistic per detector. Middle panel: signal-to-noise ratio on visibility amplitudes. Right panel: contributions of the statistical and systematic errors on visibility amplitudes.
Current usage metrics show cumulative count of Article Views (full-text article views including HTML views, PDF and ePub downloads, according to the available data) and Abstracts Views on Vision4Press platform.
Data correspond to usage on the plateform after 2015. The current usage metrics is available 48-96 hours after online publication and is updated daily on week days.
Initial download of the metrics may take a while.