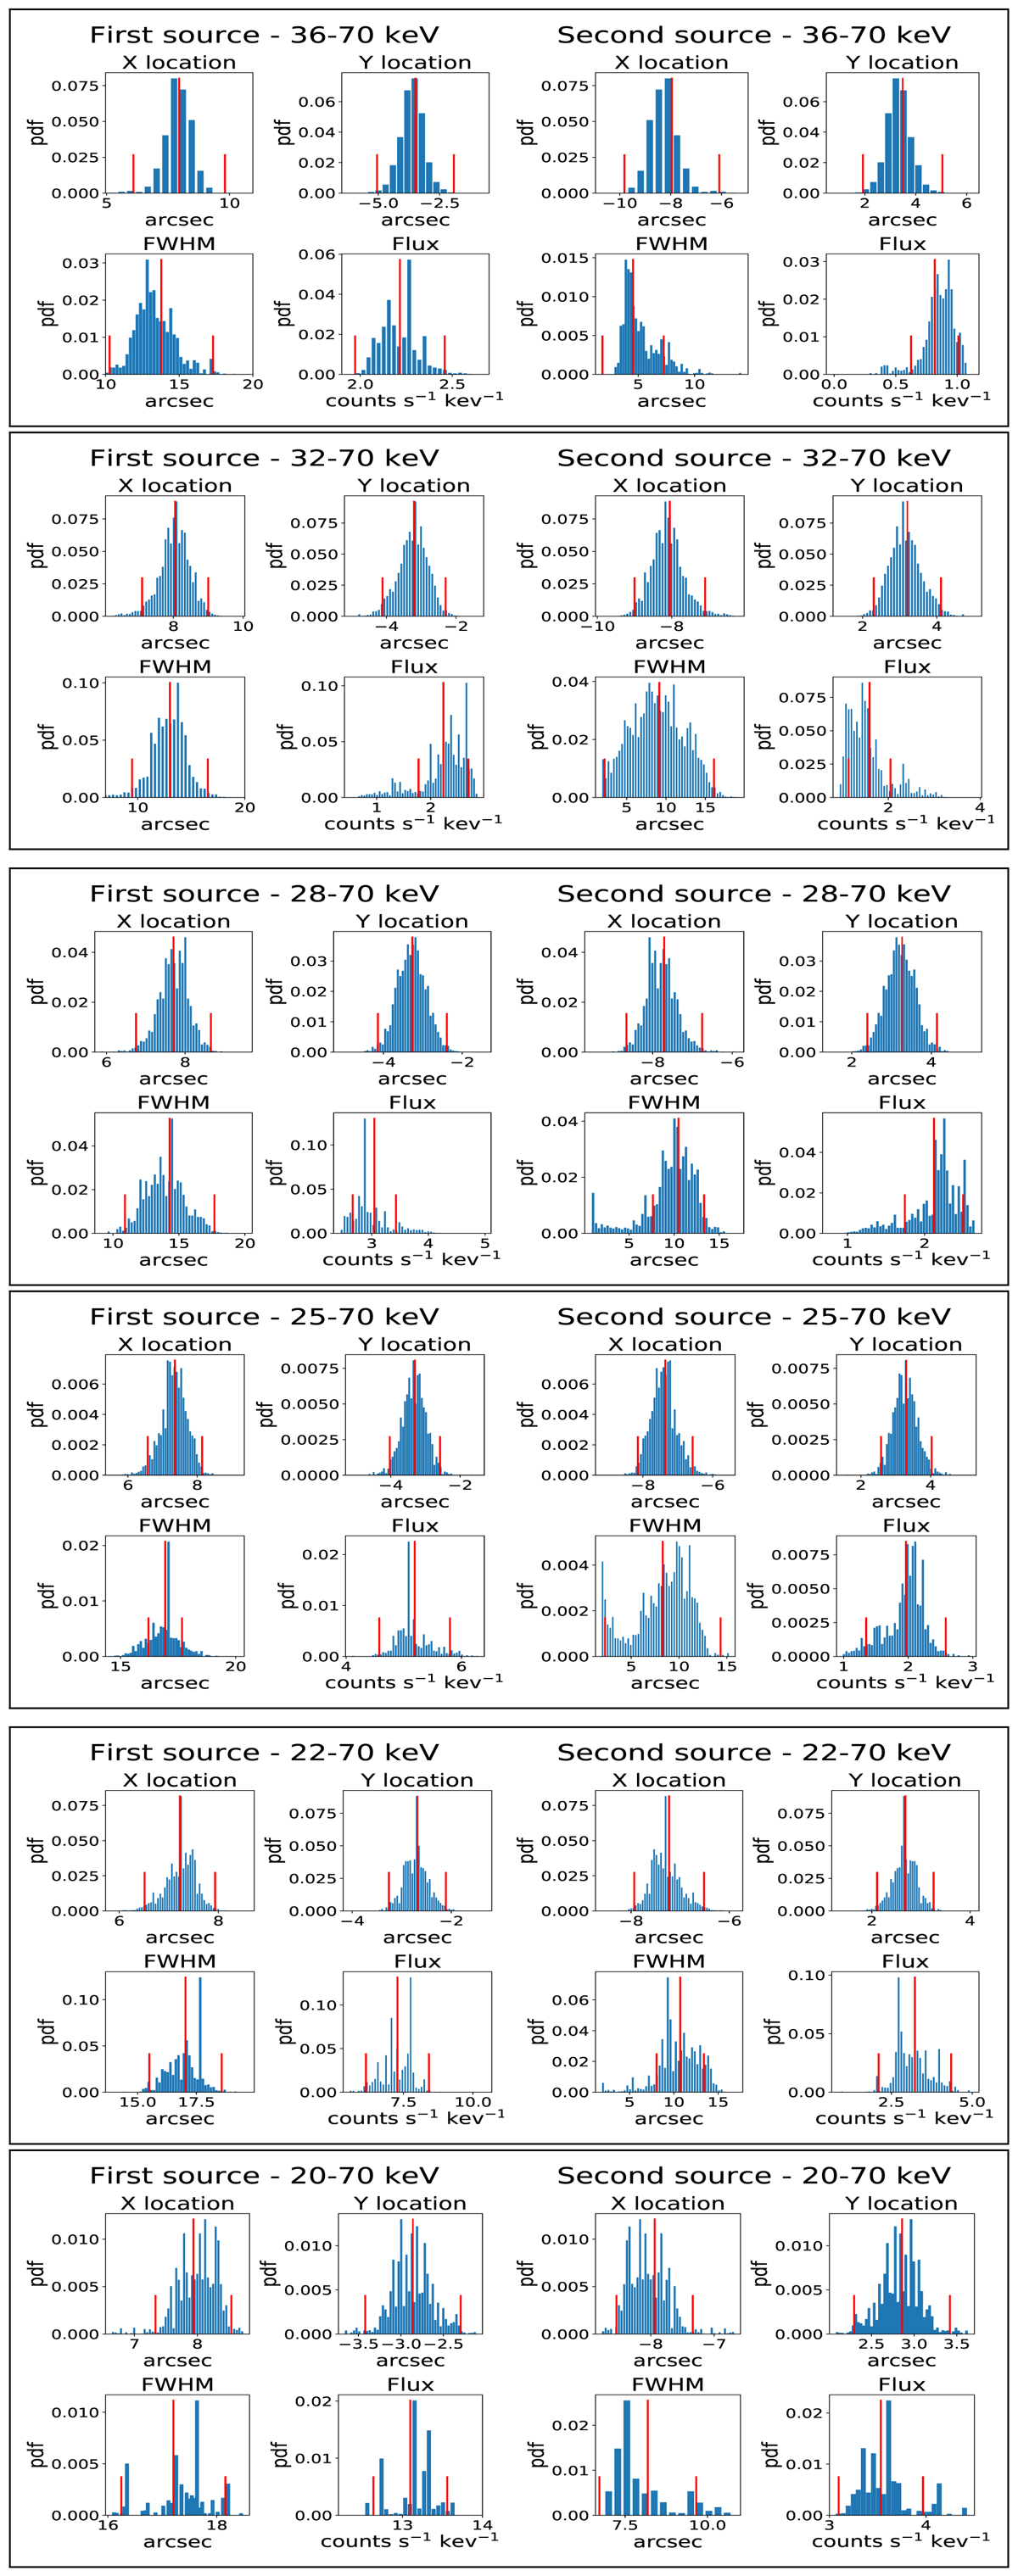
Fig. 6.
Download original image
Parameter histograms returned by the SMC reconstruction from the visibility amplitudes observed by STIX at 05:45:30 UT – 05:46:15 UT on November 18, 2020. From top to bottom: each box contains the histograms corresponding to the energy channels E1, E2, E3, E4, E5, and E6, respectively. Each of the six boxes contains the probability distributions of the sources locations and associated FWHM and fluxes. In red, we show the estimated means (used to provide the reconstructed maps) and standard deviations.
Current usage metrics show cumulative count of Article Views (full-text article views including HTML views, PDF and ePub downloads, according to the available data) and Abstracts Views on Vision4Press platform.
Data correspond to usage on the plateform after 2015. The current usage metrics is available 48-96 hours after online publication and is updated daily on week days.
Initial download of the metrics may take a while.