Fig. 3.
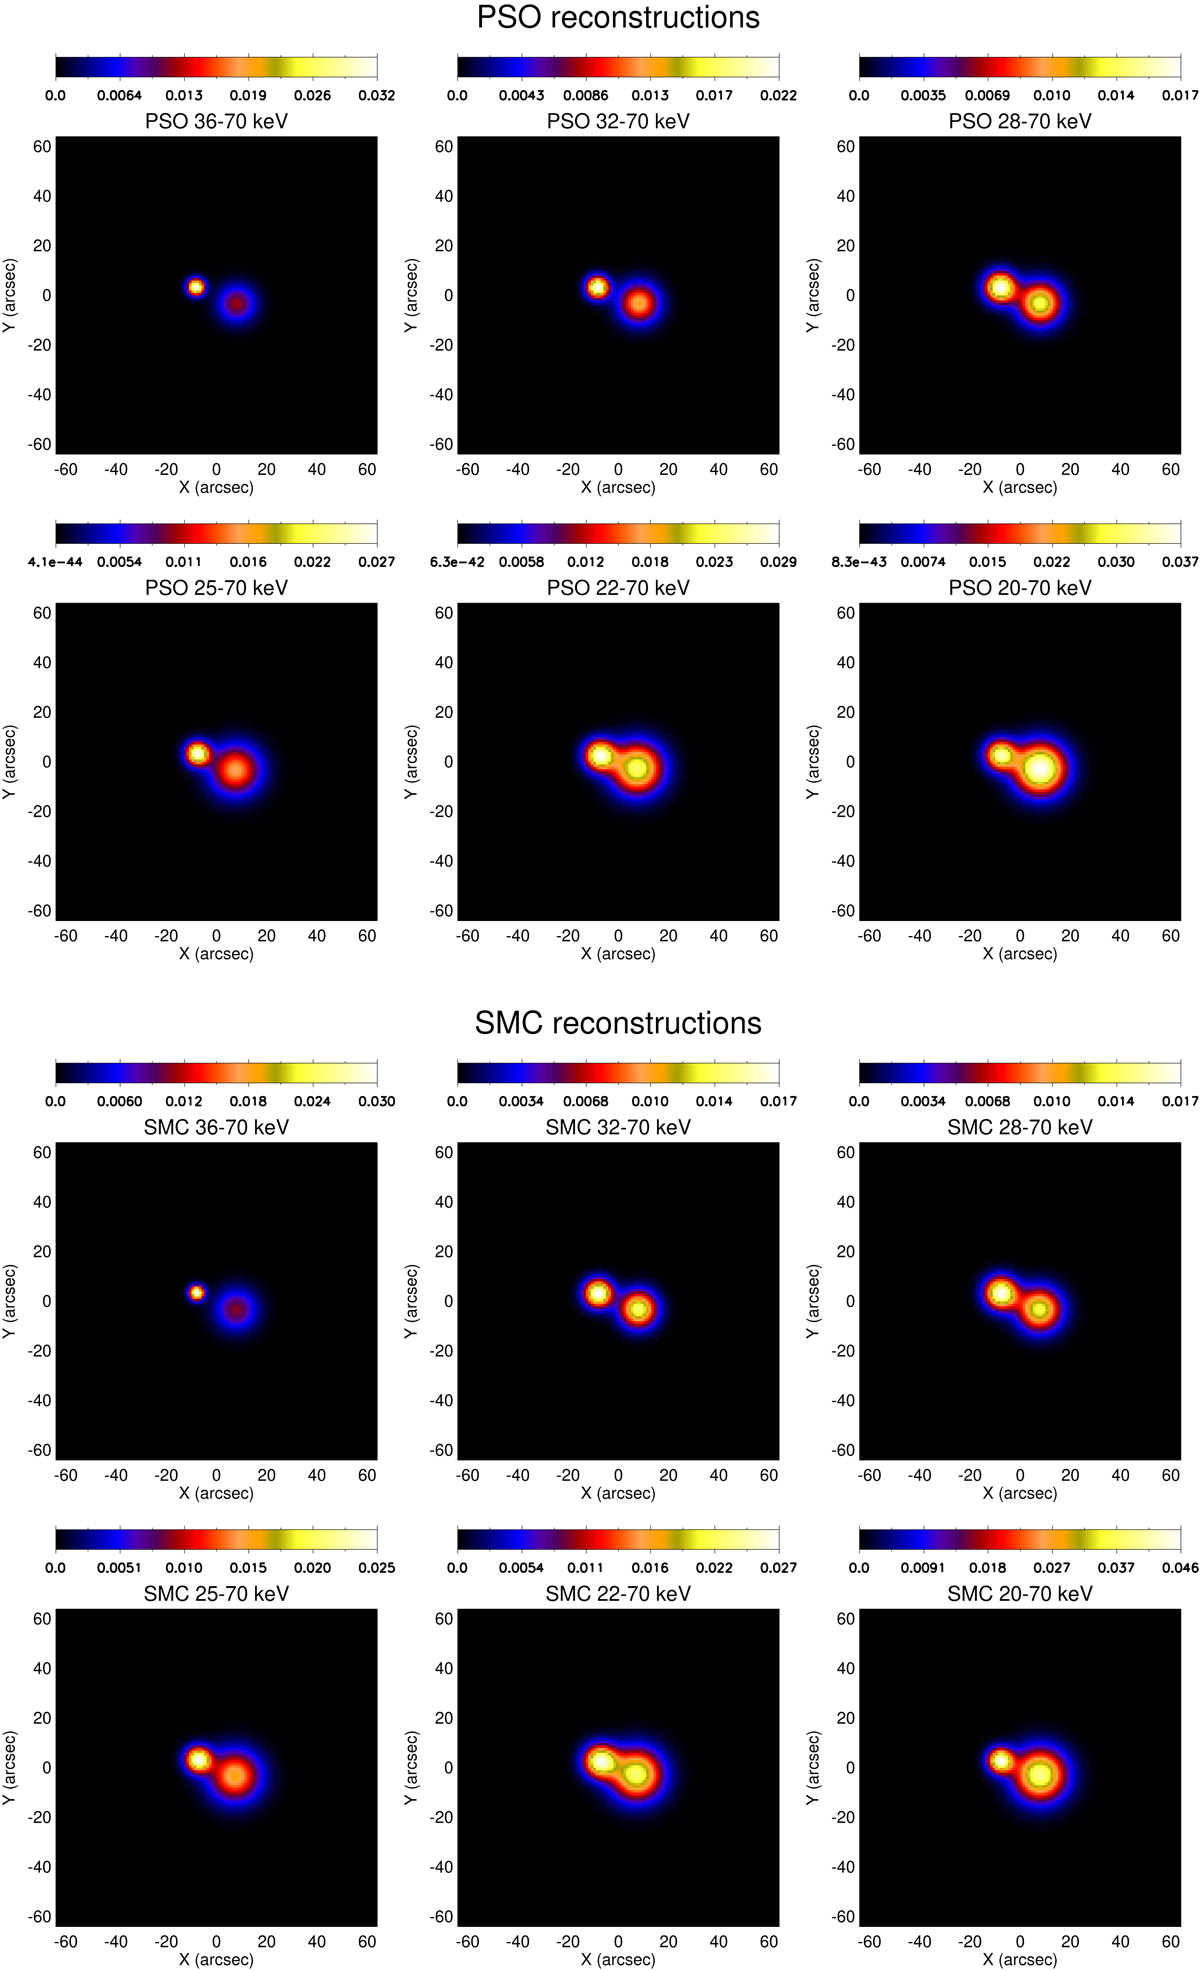
Download original image
Reconstructions computed via PSO (first box) and SMC (second box) from the visibility amplitudes observed by STIX at 05:45:30 UT–05:46:15 UT on November 18, 2020. For each box, from top to bottom, left to right: reconstructions corresponding to the energy channels E1, E2, E3, E4, E5, and E6, respectively. The SMC reconstructions use the conditional mean.
Current usage metrics show cumulative count of Article Views (full-text article views including HTML views, PDF and ePub downloads, according to the available data) and Abstracts Views on Vision4Press platform.
Data correspond to usage on the plateform after 2015. The current usage metrics is available 48-96 hours after online publication and is updated daily on week days.
Initial download of the metrics may take a while.