Fig. 9
Download original image
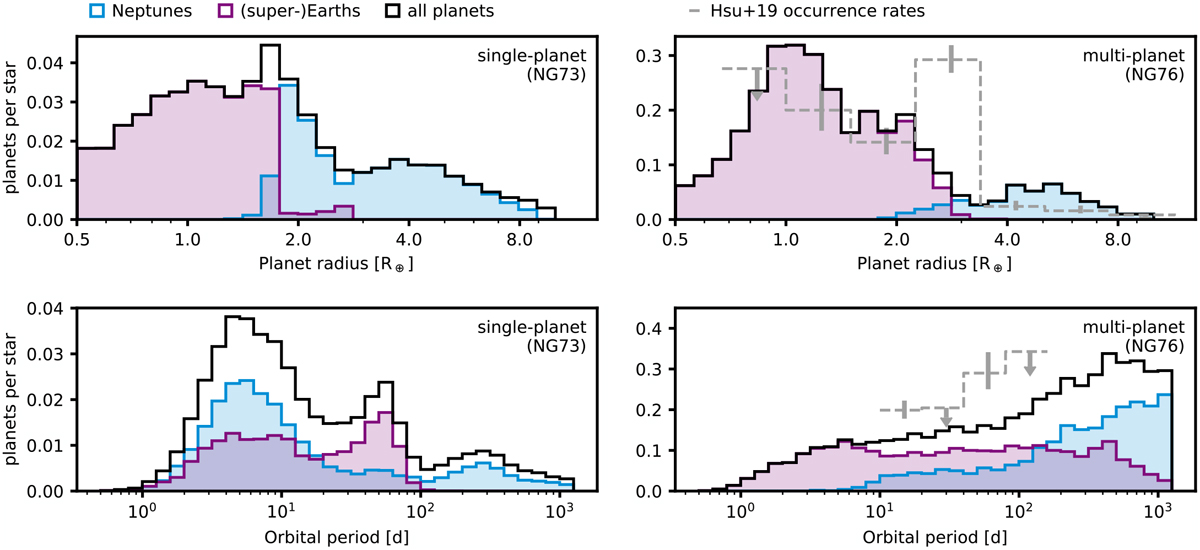
Radius and period distributions of Neptunes and (super-)Earths. The contributions by Neptunes and (super-)Earths are shown in blue and purple, respectively. Upper panels: planet radius distribution for planets with periods P < 80 d. In the single-planet case (left), a population of migrated, icy cores in the Neptunes cluster shifts the synthetic radius valley to larger radii. In the case of multiple planets per system (right), the minimum in the distribution separates (super-)Earths and Neptunes. Compared to observed occurrence rates from Kepler (Hsu et al. 2019, gray), this minimum is shifted toward larger radii. Lower panels: period distributions of planets ≥ 1 R⊕. While the single-planet population (left) shows a multi-modal distribution, the multi-planet population has a continuous slope similar to observed occurrence rates. We note the different normalizations of synthetic and observed planets.
Current usage metrics show cumulative count of Article Views (full-text article views including HTML views, PDF and ePub downloads, according to the available data) and Abstracts Views on Vision4Press platform.
Data correspond to usage on the plateform after 2015. The current usage metrics is available 48-96 hours after online publication and is updated daily on week days.
Initial download of the metrics may take a while.