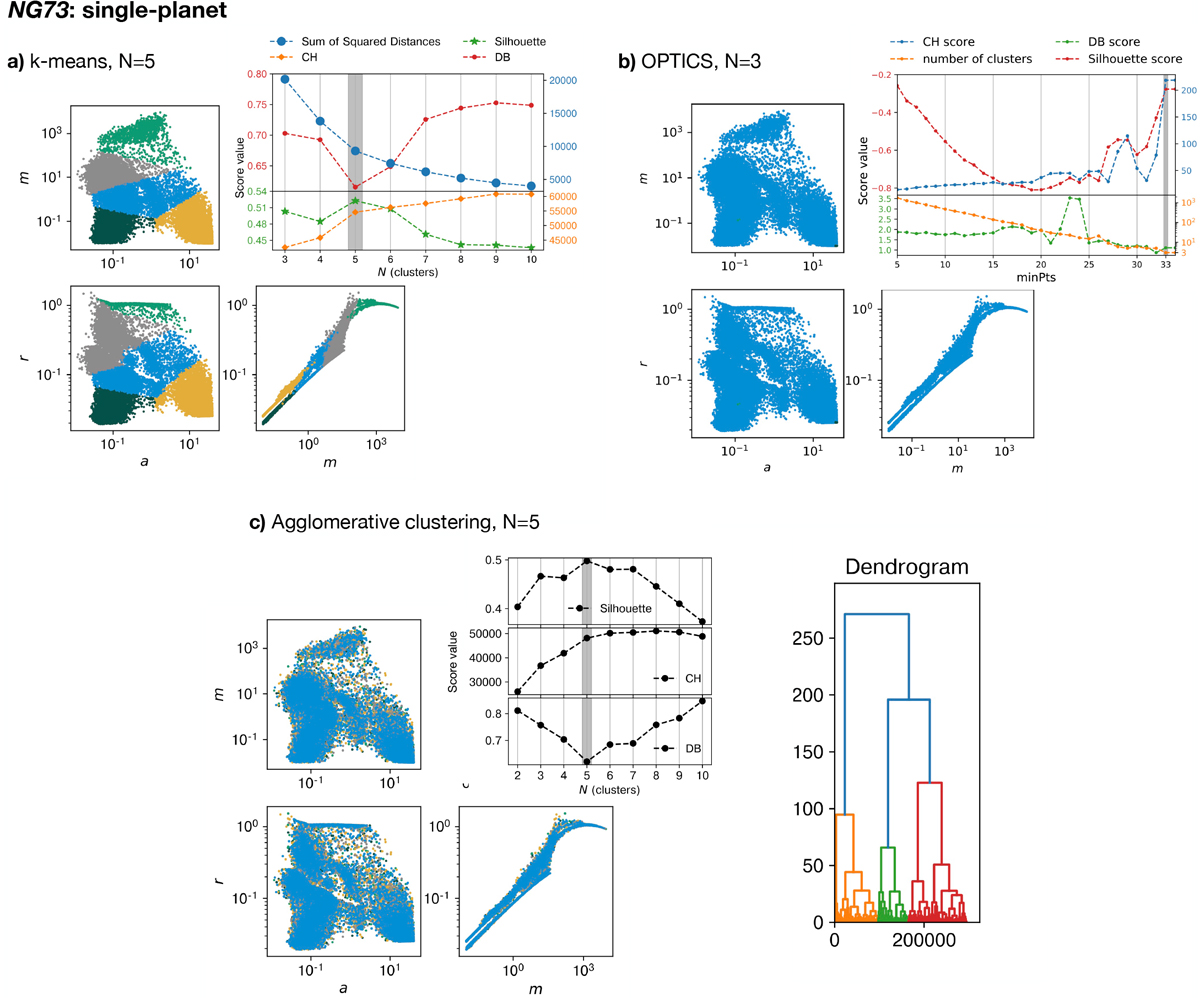
Fig. A.1
Download original image
Diagnostic plots for clustering method selection. For each alternative clustering algorithm we explored, we show the validation metrics we used to choose hyperparameters. Based on these metrics, we show the resulting clustering for the most promising choices in the corner plots. (a) Even in the best case (N = 5), k-means’ approach to draw cluster borders is too simplistic to account for the structure in our data. (b) For the numerically best choice of minPts, OPTICS finds three clusters of extremely different sizes. Most of the data belong to a single cluster that covers the whole domain, and no sensible relation to the data point density is apparent. (c) Agglomerative clustering suggests the existence of five clusters. Again, no reasonable partitioning is visible. The lower right panel shows the dendrogram corresponding to this clustering.
Current usage metrics show cumulative count of Article Views (full-text article views including HTML views, PDF and ePub downloads, according to the available data) and Abstracts Views on Vision4Press platform.
Data correspond to usage on the plateform after 2015. The current usage metrics is available 48-96 hours after online publication and is updated daily on week days.
Initial download of the metrics may take a while.