Fig. 13
Download original image
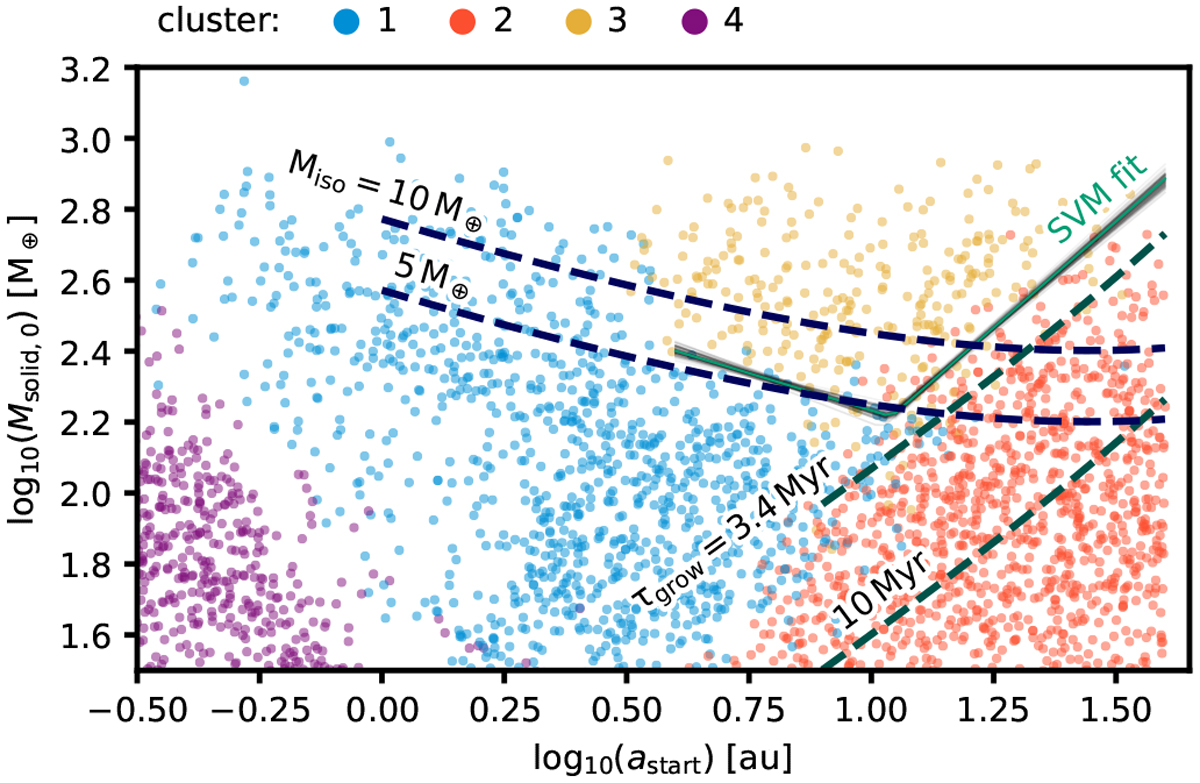
Clusters of planets in astart − Msolid,0 space of their nascent protoplanetary disk. The green line is the hyperplane that best separates the giant planet cluster (yellow markers) from the other planets and was obtained by training a Support Vector Machine (SVM). Closeby gray lines show random draws from bootstrap sampling and illustrate the uncertainties. We overplot isolines of planetesimal masses needed to reach specific core masses (blue dashed lines), as well as isolines corresponding to specific growth timescales for reaching a core mass of 10 M⊕ (green dashed lines). Their slopes are similar to the SVM fit that encloses the giant planets, indicating that the onset of runaway growth is limited by the locally available planetesimal mass and by the disk lifetime.
Current usage metrics show cumulative count of Article Views (full-text article views including HTML views, PDF and ePub downloads, according to the available data) and Abstracts Views on Vision4Press platform.
Data correspond to usage on the plateform after 2015. The current usage metrics is available 48-96 hours after online publication and is updated daily on week days.
Initial download of the metrics may take a while.