| Issue |
A&A
Volume 656, December 2021
|
|
|---|---|---|
| Article Number | A160 | |
| Number of page(s) | 16 | |
| Section | Catalogs and data | |
| DOI | https://doi.org/10.1051/0004-6361/202140309 | |
| Published online | 16 December 2021 | |
A high-spectral-resolution catalog of emission lines in the visible spectrum of comet C/2020 F3 (NEOWISE)⋆
1
INAF Astronomical Observatory of Padova, Vicolo dell’Osservatorio 5, 35122 Padova, Italy
e-mail: This email address is being protected from spambots. You need JavaScript enabled to view it.
2
Department of Physics and Astronomy “Galileo Galilei”, University of Padova, Vicolo dell’Osservatorio 3, 35141 Padova, Italy
3
INAF-IAPS, Via Fosso del Cavaliere 100, Tor Vergata, 00133 Roma, Italy
4
INAF Astronomical Observatory of Trieste, Via Tiepolo 11, 38121 Trieste, Italy
5
Fundación Galileo Galilei-INAF, Rambla José Ana Fernandez Pérez 7, 38712 Breña Baja, TF, Spain
6
Instituto de Astrofisica de Canarias, C/Via Lactea s/n, 38205 La Laguna, Tenerife, Spain
7
Departamento de Astrofisica, Univ. de La Laguna, Av. del Astrofisico Francisco Sánchez s/n, 38205 La Laguna, Tenerife, Spain
Received:
11
January
2021
Accepted:
29
September
2021
Abstract
Aims. Comet C/2020 F3 (NEOWISE) is considered to be the brightest comet observed in the northern hemisphere since the passage of comet C/1995 O1 (Hale-Bopp) in 1997. Since the study of comets offers a unique opportunity to investigate the early stages of the formation and evolution of our Sun and the Solar System, we obtained high-resolution optical spectra (R = λ/Δλ = 11 5000) of comet NEOWISE. The unique passage and its brightness yielded spectra with a large number of emission lines, providing information on the coma composition and the physical and chemical processes occurring in the nucleus. The spectra have been used to generate a catalog of emission lines to be used for future studies of comets since there are no catalogs in the literature with such a high spectral resolution.
Methods. Two high-resolution spectra of comet NEOWISE were obtained, on 26 July 2020 (geocentric distance of 0.7 AU) and 5 August 2020 (geocentric distance of 0.89 AU), with the High Accuracy Radial velocity Planet Searcher for the Northern hemisphere (HARPS-N) echelle spectrograph installed on the 360 cm Telescopio Nazionale Galileo. The spectra cover the range between 383 and 693 nm, and have been extracted using the HARPS-N Data Reduction Pipeline. To analyze the spectra and compile the high-resolution catalog, we collected several laboratory molecular line lists that cover the same wavelength range as that of our spectra. To validate the final identification, we compared our catalog with other atlases that resulted from the spectral analysis of other comets.
Results. We generate a high-spectral-resolution catalog of emission lines observed in comet NEOWISE, providing the identification for 4488 lines. We found cometary lines due to CN, CH, C2, C3, and NH2 and atomic lines due to NaI and [OI].
Key words: comets: general / comets: individual: C/2020 F3 (NEOWISE) / methods: observational / methods: data analysis
Tables C.1 and C.2 are only available at the CDS via anonymous ftp to cdsarc.u-strasbg.fr (130.79.128.5) or via http://cdsarc.u-strasbg.fr/viz-bin/cat/J/A+A/656/A160
© ESO 2021
1. Introduction
Comets are primitive bodies left over from the formation of the Solar System. Formed at a large distance from the Sun, comets have been preserved at low temperatures since their birth. Therefore, the study of comets offers a unique opportunity to investigate the physical and chemical processes that occurred during the early stages of the formation and evolution of our Sun and Solar System. Most of the species that are observed in the visible range in the coma, called daughter molecules, are the products of physical and chemical processes acting on the parent molecules in the nucleus or in the inner coma. The study of their emission lines is a large source of information on the coma composition, on the physical phenomena occurring in the coma, and on the composition of the nucleus. C/2020 F3 (NEOWISE) is a bright long-period comet that was discovered on 27 March 2020. The perihelion occurred on 3 July 2020, at a small heliocentric distance of 0.29 AU. From Earth, comet NEOWISE was observable within elongations of less than 20 degrees from the Sun between 11 June and 9 July 2020, and its closest approach occurred on 23 July 2020. By late June, a dust and blue ion tails had been observed (Knight & Battams 2020). The angular separation between the two tails was about 30 deg, and a sodium tail was confirmed on 13 July 2020 (Lin et al. 2020). Comet NEOWISE is considered to be the brightest comet observed in the northern hemisphere since the passage of comet Hale-Bopp in 1997.
Observations from the Comet OBServation (COBS) database1 of the Minor Planet Center (MPC)2 show that the comet had brightened from a visual magnitude of about 8 at the beginning of June to 0 by early July3. The unique passage of this very bright comet offered a unique opportunity to deeply investigate the emission spectrum of a comet at high resolution. In this work, we present the results of an observational study of NEOWISE carried out with the 3.6 m Telescopio Nazionale Galileo (TNG). We provide a high-spectral-resolution catalog of cometary emission lines, which is important for investigating the composition of the coma. This catalog will be a useful tool for future studies since there are few comets for which emission line catalogs are available with this resolution and signal-to-noise ratio (S/N). Four similar catalogs are available (Brown et al. 1996; Cremonese et al. 2007; Picazzio et al. 2002; Cochran & Cochran 2002), but all of them were created using spectrographs with a resolving power lower than 60 000.
2. Observations, data reduction, and emission line identification
Two high-resolution spectra of comet NEOWISE were obtained, on 26 July and 5 August 2020, using the High Accuracy Radial velocity Planet Searcher (HARPS-N) echelle spectrograph, which covers the wavelength range between 383 and 693 nm, with a resolving power of R = λ/Δλ = 11 5000. The spectrograph is fiber-fed by the Nasmyth B focus of the 360 cm TNG. Table 1 shows the observing circumstances at the moment of observations. The spectral extraction is performed automatically by the HARPS-N Data Reduction Pipeline. The pipeline implements the classical extraction method by Horne (1986). The basic processing steps consist in bias subtraction (the bias is computed on the over-scan regions of the frame), spectrum extraction, flat fielding, wavelength calibration, and normalization of the blaze continuum. The blaze-corrected spectrum is derived by dividing the extracted order spectra by the blaze function. Once individual echelle orders have been blaze-corrected, they are combined into a single spectrum. Finally, the dust-scattered solar light is removed using a high-resolution solar analogue spectrum (Land 107–684) degraded to the same spectral resolution. Details about these steps are reported in the data reduction pipeline user manual4. HARPS−N is fiber-fed by the Nasmyth B focus and has two fibers: Fiber A was put on the comet nucleus and fiber B was pointing on the sky at two arcminutes from fiber A. As comet NEOWISE was very active and has an extended coma, fiber B most likely included some cometary emissions, and it was not used to subtract the sky. We compared our catalog with the high-resolution atlas of night sky emission lines compiled by Osterbrock et al. (1996, 1997) to account for observing emission lines produced in the Earth’s atmosphere (Cochran & Cochran 2002). After Doppler-shifting our spectra equal to −Δ to the Osterbrock et al. (1996, 1997) lines, we checked the Doppler shift by verifying the night sky atomic lines of Na, O, and Hα. We report those night sky emission lines in our catalog (see Table C.1). To compile the high-resolution catalog, we collected laboratory molecular line lists that cover the same wavelength of our spectra. All the laboratory line lists we used are shown in Table 2. Once the molecular line lists were collected, we analyzed our spectra with the aim of finding wavelength coincidences of emission lines in the line lists and emission features in our spectra. We included all catalog lines that matched our observed emissions within the spectral resolution (i.e., ±3Δλ = λ/R, where R is the resolving power). To verify the reliability of our identification, we used spectra from both nights. This also made it possible to identify weaker lines. Due to the high-resolution of our spectra, the density of lines is very high. For this reason, the presence of coincidences between emission lines can occur. Each time a coincidence occurred, we checked which emission was the most appropriate, analyzing from which energy level and emission band these lines originated. Finally, to further validate the final identification, we cross-checked our identification with those reported in other cometary spectral analyses (Cremonese et al. 2007; Horne 1986; McKemmish et al. 2020; Sneden et al. 2014; Rousselot et al. 2000; Picazzio et al. 2002; Brown et al. 1996; Cochran & Cochran 2002).
Observing parameters at the moment of observations.
Laboratory line lists used in this work.
3. Results
Two high-resolution spectra of comet NEOWISE allowed us to identify 4488 comet emission lines. We found cometary lines belonging to C2, C3, CN, CH, NH2, NaI, and [OI]. Figure 1 corresponds to 26 July 2020 and shows the emission identification in different colors. Table 3 shows an example of the catalog. The list of identified and unidentified lines (see Table C.2) is coupled with high-resolution plots that show the identification of the various species. We used the spectrum of 26 July 2020 (i.e., the one with the highest S/N) as reference. The catalog provides the observed wavelength (λ) in Å, the relative intensity (Irel), the name of the molecule, and the transition (if mentioned in the reference).
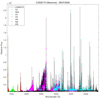 |
Fig. 1. Identification of emission lines in the spectrum of comet NEOWISE. The spectrum is from 26 July 2020. |
Section of the high-resolution catalog of emission lines of comet NEOWISE.
3.1. CN
We found CN emission lines in both spectra, some of which belong to the violet system (or the B2Σ+ → X2Σ+ band). The CN violet system at λ = 3883 Å is considered as one of the most prominent features in comet spectra, together with the Swan bands of C2, and is based on the fluorescence excitation mechanism of the solar radiation (Zucconi & Festou 1985). It is regularly observed in most comets, and the violet-system band is observed in high-resolution spectra. The spectral resolution of our spectra allows a definite structure in the 3883 Å sequence of the CN bands to be revealed, and the P branch is resolved into individual lines (see Fig. 2, top panel). For the identification, we used the line list of Kurucz (1995), which contains about 350.000 lines, and that of Davis & Phillips (1963).
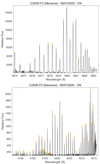 |
Fig. 2. 3883 Å CN band (top panel) and 4200 Å CN (B2Σ+ → X2Σ+) band (bottom panel) in the spectrum of comet NEOWISE. Stars indicate the identified CN emissions. |
3.2. CH
The (0−0) B2Σ− − X2Π band and the (0−0) A2Δ − X2Π band were detected in both spectra, at 3886 Å and 4314 Å, respectively (see Fig. 3). The B2Σ− − X2Π band can be resolved from CN only at high resolution. The A2Δ − X2Π band usually appears in cometary spectra as a weak band (Feldman et al. 2004). This can be due to the fact that the g factor is small (5 × 10⁻³; Feldman et al. 2004) and that the lifetime against the photodissociation is between 35 and 315 s at 1 AU (Singh & Dalgarno 1987). The value of the oscillation strength implies that even a weak feature can be the result of a significant column density. For the identification, we used the line lists of Masseron et al. (2014).
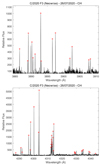 |
Fig. 3. 3886 Å CH band (top panel) and 4314 Å CH band (bottom panel) in the spectrum of comet NEOWISE. Stars indicate the identified CH emissions. |
3.3. C2
We found cometary emissions due to the C2 molecule in both spectra. C2 was the first radical identified in a cometary coma, by Donati (1864) and Huggins (1867). The Swan (d3Πg–a3Πu) and the Phillips ( ) systems are the two principal bands of C2 that can be observed in comets. The Swan system can be observed in the green, orange, and red region of the spectrum, while the near-IR and IR regions are dominated by the Phillips system. For these systems, we used the line lists of Phillips & Davis (2020), Hunaerts (1967), and Chauville et al. (1977). Figure 4 shows the Swan system in the spectrum from 26 July 2020.
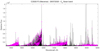 |
Fig. 4. C2 Swan band in the spectrum of comet NEOWISE. Stars indicate the identified C2 emissions. |
3.4. C3
The 4050 Å group is the most important C3 emission band in cometary spectra. The structure of this band is complex because of the Renner-Teller effect, and the bending frequency of the lower state is small. This band can be seen from 3350 Å to 4700 Å, but the range from 3900 Å to 4140 Å is considered the main part of the band. We found C3 emission lines in the 4050 Å group both in the spectrum from 26 July 2020 and in the spectrum from 5 August 2020 (see Fig. 5). Our line identifications come from Gausset et al. (1963).
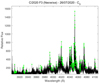 |
Fig. 5. 4050 Å C3 band in the spectrum of comet NEOWISE. |
3.5. NH2
Photolysis of ammonia by solar UV radiation in cometary comas produces the amidogen radical (NH2) in such comas (Kawakita & Mumma 2011). This radical is generally seen throughout all the visible spectrum from 4000 to 9000 Å. The transitions responsible for these emission bands are the  upper state and the
  (0,0,0) ground state. We found NH2 emissions in both spectra. The references for cometary NH2 line lists are Dressler & Ramsay (1959) and Ross et al. (1988) (see Fig. 6).
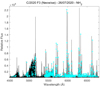 |
Fig. 6. NH2 emission in the spectrum of comet NEOWISE. Stars indicate the identified NH2 emissions. |
3.6. NaI
The sodium emission lines are caused by resonance scattering of the incoming solar light. Our high-resolution spectra reveal the presence of sodium on NEOWISE, a rare find for a comet. The identified sodium emissions belong to the sodium doublet at 5889.95 (D2) and 5895.92 (D1) Å and might be due to the emission of neutral atoms released from the nucleus (Knight & Battams 2020) or from dust particles in the inner coma (Cremonese et al. 2002). Figure 7 shows the sodium emission lines from the spectra taken on 26 July and 5 August 2020. Sodium is evident in the spectrum from 26 July 2020. The relative intensity measurements of the D1 and D2 Fraunhofer lines on 26 July 2020 are 2901.54 and 5191.38, respectively. The telluric lines are present in the spectrum from 5 August 2020, but the cometary sodium emission lines are no longer evident (in Fig. 7, bottom panel, the orange arrows indicate the position where the sodium emission lines should be located.) To confirm this trend, we compared our findings with a recent spectral analysis carried out at the end of July 2020 with the echelle spectrograph FLECHAS (Bischoff & Mugrauer 2021) at the University Observatory Jena. The sodium emission faded between 21 and 23 July 2020 and was not detectable in the FLECHAS spectra of comet NEOWISE after 29 July 2020. Bischoff & Mugrauer (2021) proposed a linear decrease in sodium emission. To compare our spectra with those obtained with FLECHAS, we degraded our spectra to the resolution of the FLECHAS instrument (R = 9300). Then, we selected the C2 band head at 5165 Å as reference (Bischoff & Mugrauer 2021) and calculated the line flux ratio between the detected sodium emission lines and the C2 band head. Table 4 reports the average values of the line flux ratios and the standard deviation both for our spectra and those obtained with the FLECHAS spectrograph. The possibility of adding a third spectrum to this analysis allowed us to find an exponential decrease in the ratio between the sodium emission lines and the C2 band head (see Fig. 8).
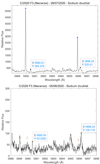 |
Fig. 7. Sodium doublet in the spectrum of comet NEOWISE. Top panel: corresponds to 26 July 2020 (D2: X = 5889.94 Å, D1: X = 5895.91 Å, and telluric lines at X = 5890.51 Å and X = 5896.24 Å). Stars indicate the location of the identified NaI emissions. Bottom panel: corresponds to 5 August 2020 (telluric lines at X = 5890.52 Å and X = 5896.23 Å). X is the wavelength in Å, and Y is the relative flux. The orange arrow indicates the position where the NaI emission should be located in the spectrum from 5 August 2020. |
Line flux ratios of the detected sodium emission lines and the strong C2 band head at 5165 Å in the spectra of comet NEOWISE.
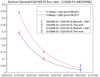 |
Fig. 8. Best fit of the line flux ratios of the detected sodium emission lines and the C2 band head at 5165 Å in the spectra of comet NEOWISE. Red data refer to Bischoff & Mugrauer (2021), and blue data refer to this work. The star represents the ratio between the D2 line at 5890 Å and the C2 line at 5165 Å. The circle represents the ratio between the D1 line at 5896 Å and the C2 line at 5165 Å. Best-fit equations and the reduced chi-square values, |

3.7. [OI]
We identified the emission of the forbidden green oxygen line at 5577.31 Å and the strong red doublet emission of [OI] at 6300.31 Å and at 6363.78 Å (see Fig. 9) in both spectra. The formation of H and OH is considered to be the major dissociative channel of H2O, but the formation of O (3P, 1S, 1D) and H2 is also possible (see Fig. 1 in Bhardwaj & Raghuram 2012). In fact, the radiative decay of metastable 1D and 1S states of atomic oxygen leads to emissions at wavelengths 6300.31 Å, 6363.78 Å, and 5577.31 Å, respectively (Bhardwaj & Raghuram 2012). In comets, the red line is more intense than the green line because the production of O (1D) via the dissociative excitation of H2O is larger compared to the radiative decay of O (1S) (Bhardwaj & Raghuram 2012). In our case, the relative intensity of the green line in the spectrum from 26 July 2020 is 3125.40, and the relative intensities of the red lines are 22720.73 and 7582.06, respectively. The spectrum from 5 August 2020 shows a relative intensity of 768.004 for the green line and of 6407.09 and 1120.85 for the red lines.
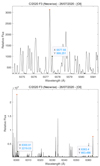 |
Fig. 9. [OI] emission in the spectrum of comet NEOWISE. Top panel: spectral range 5570−5584 Å (telluric line at X = 5577.54 Å). Bottom panel: spectral range 6290−6370 Å (telluric lines at X = 6300.91 Å and X = 6363.4 Å). Stars indicate the identified [OI] emissions. |
3.8. Fe I
The detection of iron in cometary comae is strongly related to the temperatures of comet surfaces, and ground observations detect hardly any iron emission. Recently, Manfroid et al. (2021) reported that neutral Fe I emission lines are ubiquitous in cometary comae, even far from the Sun. We therefore took the opportunity to investigate the presence of iron in comet NEOWISE due to its proximity to the Sun. We analyzed the intensities in our spectra at the iron emission lines (taken from the National Institute of Standards and Technology (NIST) Atomic Spectra Database Lines Form) and normalized them with the CN lines at 3879.66 Å. As shown in Table 5, no iron emission lines are visible in our spectra, even at a 1σ level. The ratio between the relative intensity of our spectra at the iron emission wavelength and the relative intensity of the CN emission at 3879.66 Å is less than 1%.
Iron emission analysis in the spectrum of comet NEOWISE.
3.9. Unidentified lines
The position of unidentified emission lines found in both spectra of comet NEOWISE were compared with the list of unidentified lines of comets 23P/Brorsen-Metcalf (Brown et al. 1996), 109P/Swift-Tuttle (Brown et al. 1996), 122P/de Vico (Cochran & Cochran 2002), and 153P/Ikeya-Zhang (Cremonese et al. 2007). The comparison allows one to recognize which unidentified lines could be considered spectral marks of the same transition in different comets. Figure 10 shows a section of the spectrum in which unidentified lines are present. The comparison shows that such unidentified lines are also found in other comets.
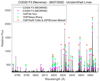 |
Fig. 10. Comparison between unidentified lines found in comets NEOWISE, 23P/Brorsen-Metcalf, 109P/Swift-Tuttle, 122P/de Vico, and 153P/Ikeya-Zhang. Magenta, cyan, green, and red stars indicate the unidentified lines found in comet NEOWISE, 122P/de Vico, 153P/Ikeya-Zhang and 109P/Swift-Tuttle, and 23P/Brorsen-Metcalf, respectively. |
4. Discussion and conclusions
Comets are leftovers from the formation of the Solar System, and their composition can be interpreted as the primordial composition of the original planetesimals. Approaching the Sun, a comet begins to heat up and the ice begins to sublimate. The subsequent ejection of dust and gas from the nucleus results in the formation of the coma and distinct tails. In this context, spectroscopic observations of comets allow both the composition and the physical conditions of these minor bodies to be determined. The visible is dominated by daughter species that resulted from photochemical processes acting on the parent species contained in the icy nucleus of the comet. High-resolution represented an important progress in the study of cometary spectra. In this study, we used the HARPS-North echelle spectrograph installed on the 360 cm TNG to obtain optical spectra of comet NEOWISE. Two high-resolution spectra were obtained, on 26 July and 5 August 2020, and we identified 4488 emission lines. We found cometary lines due to CN, CH, C2, C3, and NH2 in both
spectra as well as strong emissions of NaI and [OI]. The high-resolution catalog is coupled with high-resolution plots that show the identification. In particular, we reveal the definite structure of CN in the 3883 Å sequence, resolving the P branch into individual lines. The (0−0) B2Σ− − X2Π and A2Δ− − X2Π CH bands have been detected, and the B2Σ− − X2Π band is resolved from CN thanks to the resolution of our spectra. We found the structure of the C2 Swan system and the 4050 Å C3 group.
Strong emission of atomic oxygen [OH] has been detected in both spectra. The cometary green and red lines are separated from the corresponding telluric lines, and we found an intensity ratio between these lines of about 0.1, which suggests that H2O is the main source of these [OI] lines (Bhardwaj & Raghuram 2012). We identified the sodium doublet in the spectrum from 26 July 2020. The spectrum from 5 August 2020 shows the telluric lines, but the cometary sodium emission is no longer evident. For this reason, we compared our spectra with those obtained with the FLECHAS spectrograph (Bischoff & Mugrauer 2021). The two spectra correspond to 21 and 23 July 2020. After degrading our spectra, we normalized them to the line flux density of the C2 band head at 5165 Å. This allowed us to find an exponential decrease in the cometary sodium emission. Finally, we investigated the presence of iron emission lines in our spectra. We normalized the intensities in our spectra at the iron emission lines taken from the NIST database with the CN lines at 3879.66 Å, but no iron emissions are detected.
Acknowledgments
Based on observations made with the Italian Telescopio Nazionale Galileo (TNG) operated on the island of La Palma by the Fundacián Galileo Galilei of the INAF (Istituto Nazionale di Astrofisica) at the Spanish Observatorio del Roque de los Muchachos of the Instituto de Astrofisica de Canarias. This research used the facilities of the Italian Center for Astronomical Archive (IA2) operated by INAF at the Astronomical Observatory of Trieste.
References
- Bhardwaj, A., & Raghuram, S. 2012, ApJ, 748, 13 [Google Scholar]
- Bischoff, R., & Mugrauer, M. 2021, Astron. Nachr., 341, 99 [NASA ADS] [Google Scholar]
- Brown, M. E., Bouchez, A. H., Spinrad, A. H., & Johns-Krull, C. M. 1996, AJ, 112, 1197 [NASA ADS] [CrossRef] [Google Scholar]
- Chauville, J., Maillard, J., & Mantz, A. 1977, J. Mol. Spectrosc., 68, 399 [CrossRef] [Google Scholar]
- Cochran, A. L., & Cochran, W. D. 2002, Icarus, 157, 297 [NASA ADS] [CrossRef] [Google Scholar]
- Cremonese, G., Huebner, W. F., Rauer, H., & Boice, D. C. 2002, Adv. Space Res., 29, 1187 [NASA ADS] [CrossRef] [Google Scholar]
- Cremonese, G., Capria, M. T., & de Sanctis, M. C. 2007, A&A, 461, 789 [NASA ADS] [CrossRef] [EDP Sciences] [Google Scholar]
- Davis, S. P., & Phillips, J. G. 1963, The Red System (A2Π–X2 Σ) of the CN Molecule (Berkeley: University of California Press) [Google Scholar]
- Donati, G. 1864, Astron. Nachr., 62, 363 [NASA ADS] [CrossRef] [Google Scholar]
- Dressler, K., & Ramsay, D. A. 1959, Philos. Trans. R. Soc. London Ser. A: Math. Phys. Sci., 251, 553 [NASA ADS] [Google Scholar]
- Feldman, P. D., Cochran, A. L., & Combi, M. R. 2004, Comets II (Tucson: University of Arizona), 425 [Google Scholar]
- Gausset, L., Herzberg, G., Lagerqvist, A., & Rosen, B. 1963, Discussions of the Faraday Society, 35, 113 [CrossRef] [Google Scholar]
- Horne, K. 1986, PASP, 98, 609 [Google Scholar]
- Huggins, W. 1867, MNRAS, 27, 288 [NASA ADS] [CrossRef] [Google Scholar]
- Hunaerts, J. 1967, ApJ, 149, L31 [NASA ADS] [CrossRef] [Google Scholar]
- Kawakita, H., & Mumma, M. J. 2011, ApJ, 727, 91 [NASA ADS] [CrossRef] [Google Scholar]
- Knight, M., & Battams, K. 2020, ATel, 13853, 1 [NASA ADS] [Google Scholar]
- Kurucz, R. L. 1995, Astrophysical Applications of Powerful New Databases, 78, 205 [NASA ADS] [Google Scholar]
- Lin, Z.-Y., Wang, C., Ip, W.-H., et al. 2020, ATel, 13886, 1 [NASA ADS] [Google Scholar]
- Manfroid, J., Hutsemékers, D., & Jehin, E. 2021, Nature, 593, 372 [Google Scholar]
- Masseron, T., Plez, B., Van Eck, S., et al. 2014, A&A, 571, A47 [NASA ADS] [CrossRef] [EDP Sciences] [Google Scholar]
- McKemmish, L. K., Syme, A.-M., Borsovszky, J., et al. 2020, MNRAS, 497, 1081 [NASA ADS] [CrossRef] [Google Scholar]
- Osterbrock, D. E., Fulbright, J. P., Martel, A. R., et al. 1996, PASP, 108, 277 [Google Scholar]
- Osterbrock, D. E., Fulbright, J. P., & Bida, T. A. 1997, PASP, 109, 614 [NASA ADS] [CrossRef] [Google Scholar]
- Phillips, J. G., & Davis, S. P. 2020, The Swan System of the C2 Molecule (Berkeley: University of California Press) [Google Scholar]
- Picazzio, E., de Almeida, A., Andrievskii, S. M., Churyumov, K. I., & Luk’yanyk, I. V. 2002, in Asteroids, Comets, and Meteors: ACM 2002, ed. B. Warmbein, ESA Spec. Publ., 500, 713 [NASA ADS] [Google Scholar]
- Ross, S., Birss, F., Vervloet, M., & Ramsay, D. 1988, J. Mol. Spectrosc., 129, 436 [CrossRef] [Google Scholar]
- Rousselot, P., Hill, S., Burger, M., et al. 2000, Icarus, 146, 263 [NASA ADS] [CrossRef] [Google Scholar]
- Singh, P., & Dalgarno, A. 1987, Diversity and Similarity of Comets, 278 [Google Scholar]
- Sneden, C., Lucatello, S., Ram, R. S., Brooke, J. S., & Bernath, P. 2014, ApJS, 214, 26 [CrossRef] [Google Scholar]
- Zucconi, J., & Festou, M. 1985, A&A, 150, 180 [Google Scholar]
Appendix A: High-resolution plots of identified lines
This section contains both the identified and unidentified emission lines found in both spectra of comet NEOWISE.
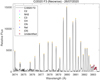 |
Fig. A.1. Identification of emission lines in the spectrum of comet NEOWISE. |
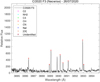 |
Fig. A.2. Identification of emission lines in the spectrum of comet NEOWISE. |
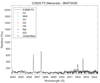 |
Fig. A.3. Identification of emission lines in the spectrum of comet NEOWISE. |
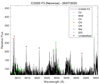 |
Fig. A.4. Identification of emission lines in the spectrum of comet NEOWISE. |
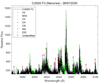 |
Fig. A.5. Identification of emission lines in the spectrum of comet NEOWISE. |
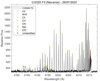 |
Fig. A.6. Identification of emission lines in the spectrum of comet NEOWISE. |
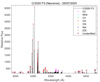 |
Fig. A.7. Identification of emission lines in the spectrum of comet NEOWISE. |
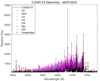 |
Fig. A.8. Identification of emission lines in the spectrum of comet NEOWISE. |
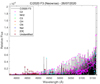 |
Fig. A.9. Identification of emission lines in the spectrum of comet NEOWISE. |
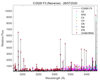 |
Fig. A.10. Identification of emission lines in the spectrum of comet NEOWISE. |
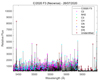 |
Fig. A.11. Identification of emission lines in the spectrum of comet NEOWISE. |
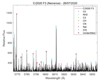 |
Fig. A.12. Identification of emission lines in the spectrum of comet NEOWISE. |
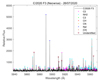 |
Fig. A.13. Identification of emission lines in the spectrum of comet NEOWISE. |
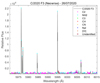 |
Fig. A.14. Identification of emission lines in the spectrum of comet NEOWISE. |
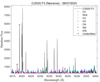 |
Fig. A.15. Identification of emission lines in the spectrum of comet NEOWISE. |
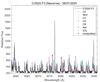 |
Fig. A.16. Identification of emission lines in the spectrum of comet NEOWISE. |
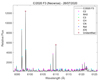 |
Fig. A.17. Identification of emission lines in the spectrum of comet NEOWISE. |
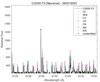 |
Fig. A.18. Identification of emission lines in the spectrum of comet NEOWISE. |
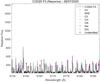 |
Fig. A.19. Identification of emission lines in the spectrum of comet NEOWISE. |
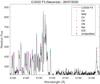 |
Fig. A.20. Identification of emission lines in the spectrum of comet NEOWISE. |
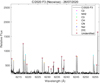 |
Fig. A.21. Identification of emission lines in the spectrum of comet NEOWISE. |
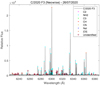 |
Fig. A.22. Identification of emission lines in the spectrum of comet NEOWISE. |
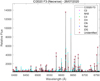 |
Fig. A.23. Identification of emission lines in the spectrum of comet NEOWISE. |
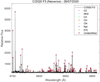 |
Fig. A.24. Identification of emission lines in the spectrum of comet NEOWISE. |
Appendix B: High-resolution plots of unidentified lines compared to other comets
This section contains the unidentified emission lines found in both spectra of comet NEOWISE. We compared the position with the list of unidentified lines of comets 23P/Brorsen-Metcalf (Brown et al. 1996), 109P/Swift-Tuttle (Brown et al. 1996), 122P/de Vico (Cochran & Cochran 2002), and 153P/Ikeya-Zhang (Cremonese et al. 2007).
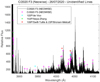 |
Fig. B.1. Unidentified emission lines found in both spectra of comet NEOWISE. Magenta stars refer to comet NEOWISE, cyan stars refer to comet 122P/de Vico, green stars refers to comet 153P/Ikeya-Zhang, and red stars refer to comets 109P/Swift-Tuttle and 23P/Brorsen-Metacalf. |
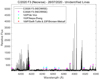 |
Fig. B.2. Unidentified emission lines found in both spectra of comet NEOWISE. Magenta stars refer to comet NEOWISE, cyan stars refer to comet 122P/de Vico, green stars refers to comet 153P/Ikeya-Zhang, and red stars refer to comets 109P/Swift-Tuttle and 23P/Brorsen-Metacalf. |
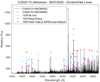 |
Fig. B.3. Unidentified emission lines found in both spectra of comet NEOWISE. Magenta stars refer to comet NEOWISE, cyan stars refer to comet 122P/de Vico, green stars refers to comet 153P/Ikeya-Zhang, and red stars refer to comets 109P/Swift-Tuttle and 23P/Brorsen-Metacalf. |
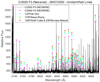 |
Fig. B.4. Unidentified emission lines found in both spectra of comet NEOWISE. Magenta stars refer to comet NEOWISE, cyan stars refer to comet 122P/de Vico, green stars refers to comet 153P/Ikeya-Zhang, and red stars refer to comets 109P/Swift-Tuttle and 23P/Brorsen-Metacalf. |
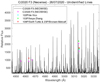 |
Fig. B.5. Unidentified emission lines found in both spectra of comet NEOWISE. Magenta stars refer to comet NEOWISE, cyan stars refer to comet 122P/de Vico, green stars refers to comet 153P/Ikeya-Zhang, and red stars refer to comets 109P/Swift-Tuttle and 23P/Brorsen-Metacalf. |
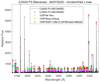 |
Fig. B.6. Unidentified emission lines found in both spectra of comet NEOWISE. Magenta stars refer to comet NEOWISE, cyan stars refer to comet 122P/de Vico, green stars refers to comet 153P/Ikeya-Zhang, and red stars refer to comets 109P/Swift-Tuttle and 23P/Brorsen-Metacalf. |
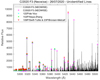 |
Fig. B.7. Unidentified emission lines found in both spectra of comet NEOWISE. Magenta stars refer to comet NEOWISE, cyan stars refer to comet 122P/de Vico, green stars refers to comet 153P/Ikeya-Zhang, and red stars refer to comets 109P/Swift-Tuttle and 23P/Brorsen-Metacalf. |
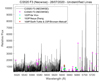 |
Fig. B.8. Unidentified emission lines found in both spectra of comet NEOWISE. Magenta stars refer to comet NEOWISE, cyan stars refer to comet 122P/de Vico, green stars refers to comet 153P/Ikeya-Zhang, and red stars refer to comets 109P/Swift-Tuttle and 23P/Brorsen-Metacalf. |
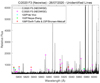 |
Fig. B.9. Unidentified emission lines found in both spectra of comet NEOWISE. Magenta stars refer to comet NEOWISE, cyan stars refer to comet 122P/de Vico, green stars refers to comet 153P/Ikeya-Zhang, and red stars refer to comets 109P/Swift-Tuttle and 23P/Brorsen-Metacalf. |
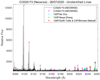 |
Fig. B.10. Unidentified emission lines found in both spectra of comet NEOWISE. Magenta stars refer to comet NEOWISE, cyan stars refer to comet 122P/de Vico, green stars refers to comet 153P/Ikeya-Zhang, and red stars refer to comets 109P/Swift-Tuttle and 23P/Brorsen-Metacalf. |
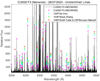 |
Fig. B.11. Unidentified emission lines found in both spectra of comet NEOWISE. Magenta stars refer to comet NEOWISE, cyan stars refer to comet 122P/de Vico, green stars refers to comet 153P/Ikeya-Zhang, and red stars refer to comets 109P/Swift-Tuttle and 23P/Brorsen-Metacalf. |
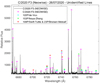 |
Fig. B.12. Unidentified emission lines found in both spectra of comet NEOWISE. Magenta stars refer to comet NEOWISE, cyan stars refer to comet 122P/de Vico, green stars refers to comet 153P/Ikeya-Zhang, and red stars refer to comets 109P/Swift-Tuttle and 23P/Brorsen-Metacalf. |
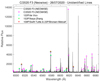 |
Fig. B.13. Unidentified emission lines found in both spectra of comet NEOWISE. Magenta stars refer to comet NEOWISE, cyan stars refer to comet 122P/de Vico, green stars refers to comet 153P/Ikeya-Zhang, and red stars refer to comets 109P/Swift-Tuttle and 23P/Brorsen-Metacalf. |
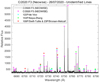 |
Fig. B.14. Unidentified emission lines found in both spectra of comet NEOWISE. Magenta stars refer to comet NEOWISE, cyan stars refer to comet 122P/de Vico, green stars refers to comet 153P/Ikeya-Zhang, and red stars refer to comets 109P/Swift-Tuttle and 23P/Brorsen-Metacalf. |
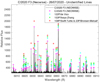 |
Fig. B.15. Unidentified emission lines found in both spectra of comet NEOWISE. Magenta stars refer to comet NEOWISE, cyan stars refer to comet 122P/de Vico, green stars refers to comet 153P/Ikeya-Zhang, and red stars refer to comets 109P/Swift-Tuttle and 23P/Brorsen-Metacalf. |
All Tables
Line flux ratios of the detected sodium emission lines and the strong C2 band head at 5165 Å in the spectra of comet NEOWISE.
All Figures
|
Fig. 1. Identification of emission lines in the spectrum of comet NEOWISE. The spectrum is from 26 July 2020. |
| In the text | |
|
Fig. 2. 3883 Å CN band (top panel) and 4200 Å CN (B2Σ+ → X2Σ+) band (bottom panel) in the spectrum of comet NEOWISE. Stars indicate the identified CN emissions. |
| In the text | |
|
Fig. 3. 3886 Å CH band (top panel) and 4314 Å CH band (bottom panel) in the spectrum of comet NEOWISE. Stars indicate the identified CH emissions. |
| In the text | |
|
Fig. 4. C2 Swan band in the spectrum of comet NEOWISE. Stars indicate the identified C2 emissions. |
| In the text | |
|
Fig. 5. 4050 Å C3 band in the spectrum of comet NEOWISE. |
| In the text | |
|
Fig. 6. NH2 emission in the spectrum of comet NEOWISE. Stars indicate the identified NH2 emissions. |
| In the text | |
|
Fig. 7. Sodium doublet in the spectrum of comet NEOWISE. Top panel: corresponds to 26 July 2020 (D2: X = 5889.94 Å, D1: X = 5895.91 Å, and telluric lines at X = 5890.51 Å and X = 5896.24 Å). Stars indicate the location of the identified NaI emissions. Bottom panel: corresponds to 5 August 2020 (telluric lines at X = 5890.52 Å and X = 5896.23 Å). X is the wavelength in Å, and Y is the relative flux. The orange arrow indicates the position where the NaI emission should be located in the spectrum from 5 August 2020. |
| In the text | |
|
Fig. 8. Best fit of the line flux ratios of the detected sodium emission lines and the C2 band head at 5165 Å in the spectra of comet NEOWISE. Red data refer to Bischoff & Mugrauer (2021), and blue data refer to this work. The star represents the ratio between the D2 line at 5890 Å and the C2 line at 5165 Å. The circle represents the ratio between the D1 line at 5896 Å and the C2 line at 5165 Å. Best-fit equations and the reduced chi-square values, |
| In the text | |
|
Fig. 9. [OI] emission in the spectrum of comet NEOWISE. Top panel: spectral range 5570−5584 Å (telluric line at X = 5577.54 Å). Bottom panel: spectral range 6290−6370 Å (telluric lines at X = 6300.91 Å and X = 6363.4 Å). Stars indicate the identified [OI] emissions. |
| In the text | |
|
Fig. 10. Comparison between unidentified lines found in comets NEOWISE, 23P/Brorsen-Metcalf, 109P/Swift-Tuttle, 122P/de Vico, and 153P/Ikeya-Zhang. Magenta, cyan, green, and red stars indicate the unidentified lines found in comet NEOWISE, 122P/de Vico, 153P/Ikeya-Zhang and 109P/Swift-Tuttle, and 23P/Brorsen-Metcalf, respectively. |
| In the text | |
|
Fig. A.1. Identification of emission lines in the spectrum of comet NEOWISE. |
| In the text | |
|
Fig. A.2. Identification of emission lines in the spectrum of comet NEOWISE. |
| In the text | |
|
Fig. A.3. Identification of emission lines in the spectrum of comet NEOWISE. |
| In the text | |
|
Fig. A.4. Identification of emission lines in the spectrum of comet NEOWISE. |
| In the text | |
|
Fig. A.5. Identification of emission lines in the spectrum of comet NEOWISE. |
| In the text | |
|
Fig. A.6. Identification of emission lines in the spectrum of comet NEOWISE. |
| In the text | |
|
Fig. A.7. Identification of emission lines in the spectrum of comet NEOWISE. |
| In the text | |
|
Fig. A.8. Identification of emission lines in the spectrum of comet NEOWISE. |
| In the text | |
|
Fig. A.9. Identification of emission lines in the spectrum of comet NEOWISE. |
| In the text | |
|
Fig. A.10. Identification of emission lines in the spectrum of comet NEOWISE. |
| In the text | |
|
Fig. A.11. Identification of emission lines in the spectrum of comet NEOWISE. |
| In the text | |
|
Fig. A.12. Identification of emission lines in the spectrum of comet NEOWISE. |
| In the text | |
|
Fig. A.13. Identification of emission lines in the spectrum of comet NEOWISE. |
| In the text | |
|
Fig. A.14. Identification of emission lines in the spectrum of comet NEOWISE. |
| In the text | |
|
Fig. A.15. Identification of emission lines in the spectrum of comet NEOWISE. |
| In the text | |
|
Fig. A.16. Identification of emission lines in the spectrum of comet NEOWISE. |
| In the text | |
|
Fig. A.17. Identification of emission lines in the spectrum of comet NEOWISE. |
| In the text | |
|
Fig. A.18. Identification of emission lines in the spectrum of comet NEOWISE. |
| In the text | |
|
Fig. A.19. Identification of emission lines in the spectrum of comet NEOWISE. |
| In the text | |
|
Fig. A.20. Identification of emission lines in the spectrum of comet NEOWISE. |
| In the text | |
|
Fig. A.21. Identification of emission lines in the spectrum of comet NEOWISE. |
| In the text | |
|
Fig. A.22. Identification of emission lines in the spectrum of comet NEOWISE. |
| In the text | |
|
Fig. A.23. Identification of emission lines in the spectrum of comet NEOWISE. |
| In the text | |
|
Fig. A.24. Identification of emission lines in the spectrum of comet NEOWISE. |
| In the text | |
|
Fig. B.1. Unidentified emission lines found in both spectra of comet NEOWISE. Magenta stars refer to comet NEOWISE, cyan stars refer to comet 122P/de Vico, green stars refers to comet 153P/Ikeya-Zhang, and red stars refer to comets 109P/Swift-Tuttle and 23P/Brorsen-Metacalf. |
| In the text | |
|
Fig. B.2. Unidentified emission lines found in both spectra of comet NEOWISE. Magenta stars refer to comet NEOWISE, cyan stars refer to comet 122P/de Vico, green stars refers to comet 153P/Ikeya-Zhang, and red stars refer to comets 109P/Swift-Tuttle and 23P/Brorsen-Metacalf. |
| In the text | |
|
Fig. B.3. Unidentified emission lines found in both spectra of comet NEOWISE. Magenta stars refer to comet NEOWISE, cyan stars refer to comet 122P/de Vico, green stars refers to comet 153P/Ikeya-Zhang, and red stars refer to comets 109P/Swift-Tuttle and 23P/Brorsen-Metacalf. |
| In the text | |
|
Fig. B.4. Unidentified emission lines found in both spectra of comet NEOWISE. Magenta stars refer to comet NEOWISE, cyan stars refer to comet 122P/de Vico, green stars refers to comet 153P/Ikeya-Zhang, and red stars refer to comets 109P/Swift-Tuttle and 23P/Brorsen-Metacalf. |
| In the text | |
|
Fig. B.5. Unidentified emission lines found in both spectra of comet NEOWISE. Magenta stars refer to comet NEOWISE, cyan stars refer to comet 122P/de Vico, green stars refers to comet 153P/Ikeya-Zhang, and red stars refer to comets 109P/Swift-Tuttle and 23P/Brorsen-Metacalf. |
| In the text | |
|
Fig. B.6. Unidentified emission lines found in both spectra of comet NEOWISE. Magenta stars refer to comet NEOWISE, cyan stars refer to comet 122P/de Vico, green stars refers to comet 153P/Ikeya-Zhang, and red stars refer to comets 109P/Swift-Tuttle and 23P/Brorsen-Metacalf. |
| In the text | |
|
Fig. B.7. Unidentified emission lines found in both spectra of comet NEOWISE. Magenta stars refer to comet NEOWISE, cyan stars refer to comet 122P/de Vico, green stars refers to comet 153P/Ikeya-Zhang, and red stars refer to comets 109P/Swift-Tuttle and 23P/Brorsen-Metacalf. |
| In the text | |
|
Fig. B.8. Unidentified emission lines found in both spectra of comet NEOWISE. Magenta stars refer to comet NEOWISE, cyan stars refer to comet 122P/de Vico, green stars refers to comet 153P/Ikeya-Zhang, and red stars refer to comets 109P/Swift-Tuttle and 23P/Brorsen-Metacalf. |
| In the text | |
|
Fig. B.9. Unidentified emission lines found in both spectra of comet NEOWISE. Magenta stars refer to comet NEOWISE, cyan stars refer to comet 122P/de Vico, green stars refers to comet 153P/Ikeya-Zhang, and red stars refer to comets 109P/Swift-Tuttle and 23P/Brorsen-Metacalf. |
| In the text | |
|
Fig. B.10. Unidentified emission lines found in both spectra of comet NEOWISE. Magenta stars refer to comet NEOWISE, cyan stars refer to comet 122P/de Vico, green stars refers to comet 153P/Ikeya-Zhang, and red stars refer to comets 109P/Swift-Tuttle and 23P/Brorsen-Metacalf. |
| In the text | |
|
Fig. B.11. Unidentified emission lines found in both spectra of comet NEOWISE. Magenta stars refer to comet NEOWISE, cyan stars refer to comet 122P/de Vico, green stars refers to comet 153P/Ikeya-Zhang, and red stars refer to comets 109P/Swift-Tuttle and 23P/Brorsen-Metacalf. |
| In the text | |
|
Fig. B.12. Unidentified emission lines found in both spectra of comet NEOWISE. Magenta stars refer to comet NEOWISE, cyan stars refer to comet 122P/de Vico, green stars refers to comet 153P/Ikeya-Zhang, and red stars refer to comets 109P/Swift-Tuttle and 23P/Brorsen-Metacalf. |
| In the text | |
|
Fig. B.13. Unidentified emission lines found in both spectra of comet NEOWISE. Magenta stars refer to comet NEOWISE, cyan stars refer to comet 122P/de Vico, green stars refers to comet 153P/Ikeya-Zhang, and red stars refer to comets 109P/Swift-Tuttle and 23P/Brorsen-Metacalf. |
| In the text | |
|
Fig. B.14. Unidentified emission lines found in both spectra of comet NEOWISE. Magenta stars refer to comet NEOWISE, cyan stars refer to comet 122P/de Vico, green stars refers to comet 153P/Ikeya-Zhang, and red stars refer to comets 109P/Swift-Tuttle and 23P/Brorsen-Metacalf. |
| In the text | |
|
Fig. B.15. Unidentified emission lines found in both spectra of comet NEOWISE. Magenta stars refer to comet NEOWISE, cyan stars refer to comet 122P/de Vico, green stars refers to comet 153P/Ikeya-Zhang, and red stars refer to comets 109P/Swift-Tuttle and 23P/Brorsen-Metacalf. |
| In the text | |
Current usage metrics show cumulative count of Article Views (full-text article views including HTML views, PDF and ePub downloads, according to the available data) and Abstracts Views on Vision4Press platform.
Data correspond to usage on the plateform after 2015. The current usage metrics is available 48-96 hours after online publication and is updated daily on week days.
Initial download of the metrics may take a while.