Fig. 8.
Download original image
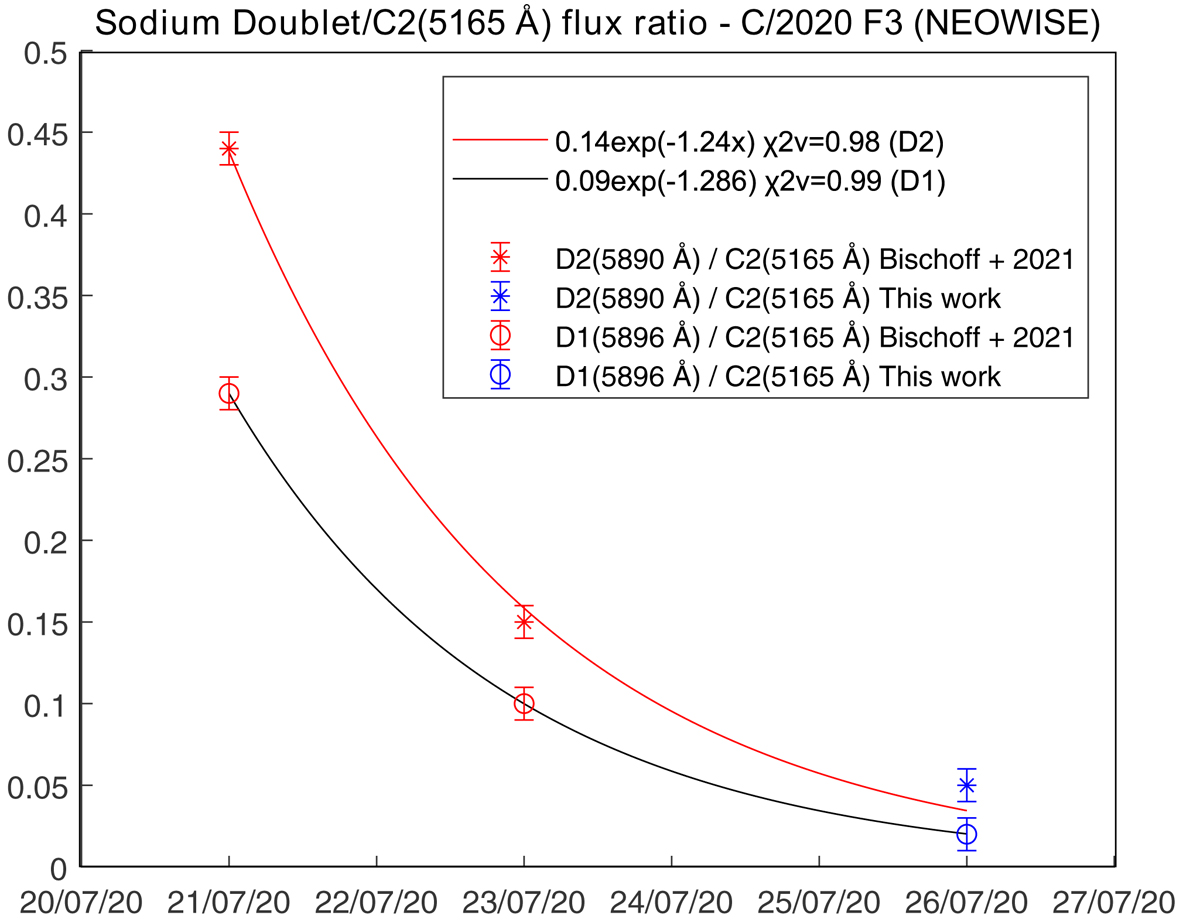
Best fit of the line flux ratios of the detected sodium emission lines and the C2 band head at 5165 Å in the spectra of comet NEOWISE. Red data refer to Bischoff & Mugrauer (2021), and blue data refer to this work. The star represents the ratio between the D2 line at 5890 Å and the C2 line at 5165 Å. The circle represents the ratio between the D1 line at 5896 Å and the C2 line at 5165 Å. Best-fit equations and the reduced chi-square values, ![]() , are reported.
, are reported.
Current usage metrics show cumulative count of Article Views (full-text article views including HTML views, PDF and ePub downloads, according to the available data) and Abstracts Views on Vision4Press platform.
Data correspond to usage on the plateform after 2015. The current usage metrics is available 48-96 hours after online publication and is updated daily on week days.
Initial download of the metrics may take a while.