| Issue |
A&A
Volume 656, December 2021
|
|
|---|---|---|
| Article Number | A47 | |
| Number of page(s) | 6 | |
| Section | Extragalactic astronomy | |
| DOI | https://doi.org/10.1051/0004-6361/202040273 | |
| Published online | 02 December 2021 | |
Contribution of flares from tidal disruptions of stars to high-redshift AGN
1
Département de Physique Théorique, Université de Genève, 24 quai Ernest-Ansermet, 1211 Genève 4, Switzerland
e-mail: This email address is being protected from spambots. You need JavaScript enabled to view it.
2
Astronomy Department, Harvard University, 60 Garden Street, Cambridge, MA 02138, USA
e-mail: This email address is being protected from spambots. You need JavaScript enabled to view it.
Received:
31
December
2020
Accepted:
23
August
2021
Abstract
We explore the contribution of tidal disruption events (TDEs) to the flares in Active Galactic Nuclei (AGN) at high redshifts. Using the latest data available from X-ray and optical observations of high-redshift galaxies, in combination with the evolution of their central supermassive black holes, we calculate the contribution of TDE to AGNs as a function of their luminosities. We find that at low redshifts (z < 1), a few percent of all AGN with bolometric luminosities LBol ≲ 1044 erg s−1 may be attributable to possible TDEs. However, this fraction can significantly increase at earlier cosmic times, including up to several tens of percent of the population of AGN at z ≳ 3. TDEs may comprise a significant fraction of the Compton-Thick AGN population at z ≳ 3. The above findings motivate further calibrations with upcoming X-ray missions and spectroscopic surveys targeting TDE-AGN.
Key words: galaxies: active / quasars: supermassive black holes / galaxies: high-redshift
© ESO 2021
1. Introduction
Supermassive black holes (SMBHs) are known to exist at the centres of galaxies (for reviews, see, e.g., Kormendy & Ho 2013; Graham 2016). The luminosity function of active galactic nuclei (AGN) constrains the growth of SMBHs that accrete at high efficiencies for extended periods of time. However, the majority of galactic nuclei are dormant and low luminosity AGN are difficult to study due to our incomplete knowledge of their accretion processes. One of the major unsolved problems in AGN research involves the fueling of low-luminosity AGN (e.g., Martini 2004) and the growth history of SMBHs in the early universe.
A key contribution in the fueling of AGN, especially at low luminosities, could be due to tidal disruption events (TDEs), which occur when stars are deflected to a distance where they are shredded by the tidal force of the supermassive black hole when it exceeds their self-gravity (Rees 1988; Hills 1975). A significant fraction (roughly one-half) of the tidally disrupted stellar material is subsequently accreted onto the central black hole, producing a luminous flare at typically super-Eddington efficiencies (e.g., Loeb & Ulmer 1997; Kara et al. 2016). The characteristic temporal signature of a TDE is the fall-off of the initial flare with time, t, over a period of months to years (e.g., Strubbe & Quataert 2009) as t−5/3. However, if the mass of the central black hole exceeds1 about 108 M⊙, a solar-type star is swallowed whole (Kesden 2012), with no radiation being produced.
So far, there have been approximately 83 observed flares that may be consistent with possible TDEs2, spanning the radio, optical, UV, hard X-ray, and soft X-ray bands (e.g., Bloom et al. 2011; Levan et al. 2011; Cenko et al. 2012; van Velzen et al. 2011, 2021; Gezari et al. 2012; Alexander et al. 2020). This number is expected to increase by orders of magnitude with current and upcoming surveys, such as the Panoramic Survey Telescope and Rapid Response System (PanSTARRS3), the Zwicky Transient Factory (ZTF4), and the Rubin Observatory Legacy Survey of Space and Time (LSST5). Detailed simulations have been used to evaluate the dominant physical processes governing TDE flares in different host galaxies (e.g., Stone & Loeb 2011, 2012; Stone & Metzger 2016; Guillochon & Ramirez-Ruiz 2015). It is believed that TDEs have likely contributed to the fueling and growth of intermediate-mass black holes (IMBHs), which are considered to be the ‘missing link’ between stellar mass black holes and SMBHs (e.g., Sakurai et al. 2019; Fialkov & Loeb 2017; Alexander & Bar-Or 2017) and may have recently been discovered to be the remnant of the GW190521 merger (150 M⊙; LIGO Scientific Collaboration & Virgo Collaboration 2020a,b). Stars swallowed whole have still contributed to the growth of SMBHs above 108 M⊙. In addition, TDEs could make a significant contribution to the observed changing look (CL) phenomenon in AGN, as noted by Merloni et al. (2015), and could also explain recent trends seen in Compton-Thick (CT) AGN (Lanzuisi et al. 2018). Observations of TDEs at high redshifts, therefore, provide valuable clues toward attaining an improved understanding of the origins of the first black holes in the universe.
In this work, we use an empirical approach for constraining the contribution of TDEs in fueling AGN at early times. We extend the locally inferred relations between the central black hole mass and stellar mass of the host galaxy to high redshifts (Kormendy & Ho 2013; Nobuta et al. 2012; Caplar et al. 2015) to study the fraction of TDEs that may be expected to contribute to AGN of various bolometric luminosities as a function of redshift. We explore the dependence of these results on specific AGN populations, such as changing look quasars (CLQs; e.g., MacLeod et al. 2019; Yang et al. 2018; Stern et al. 2018; Ross et al. 2018) and Compton-Thick (CT; e.g., Malizia et al. 2009; Baloković et al. 2014; Marchesi et al. 2018) AGN. Our results provide a useful benchmark in combining the high-redshift TDE data anticipated from upcoming time domain optical surveys (such as LSST) with those from X-ray studies of AGN populations. Furthermore, these findings can also be used to place important constraints on the expected gravitational wave event rates associated with binary IMBH and SMBH mergers, detectable by the forthcoming Laser Interferometer Space Antenna (LISA6) mission.
This paper is organized as follows. In Sect. 2, we review the basic formalism connecting TDE rates to the properties of their host galaxies and central black holes. We describe the probability of TDEs arising in AGN as a function of their bolometric luminosity, accretion efficiency, and host galaxy properties, and we extend this framework to high redshifts. In Sect. 3, we combine the TDE probabilities with the latest compilations of absorbed and unabsorbed AGN luminosity functions (Aird et al. 2015) as well as the empirical evolution of the stellar masses in galaxies. We apply this to specific cases of AGN populations in Sect. 4 to estimate the contribution of TDEs to CLQs and CT AGN. Finally, we summarize our findings and discuss future observational prospects in Sect. 5.
2. TDEs at high redshift
We start with the analytical expression for the distribution function of TDEs in AGN, defined as the probability of a galaxy hosting a black hole of mass, MBH, whose bolometric luminosity lies between log10Lbol and log10Lbol + dlog10Lbol, activated due to a TDE event. This probability is given by (e.g., Merloni et al. 2015):
 (1)
(1)
The above equation is derived based on the assumption that the AGN light curve is composed of two main phases: a “peak” phase, where the luminosity rises rapidly and saturates at a peak value for a time, tpeak, and a “declining” phase, where the light curve follows a power-law decline with the exponent γTDE = 5/37. In place of the generic function, f(Lbol/Lpeak), assumed by Merloni et al. (2015) to characterize the declining phase, we used f(Lbol/Lpeak) = exp(−Lbol/Lpeak), where the function, f, is assumed to be asymptotic to near-unity for Lbol ≪ Lpeak and drops exponentially at large Lbol, so that the exponential form represents a natural choice for the purposes of the present work. The term ΓTDE is the rate of TDEs with peak luminosity, Lpeak, occurring over a timescale, tpeak, in an AGN of bolometric luminosity, Lbol. For an individual galaxy, the bolometric luminosity, Lbol, may be related to the mass of the central supermassive black hole, MBH, by the relation:
 (2)
(2)
where we introduce the Eddington ratio, η, and the Eddington luminosity, LEdd, of the central black hole. For a population of active galaxies, the distribution of the Eddington ratios of the central supermassive black hole may be modeled using Gaussian/log-normal or Schechter functional forms (e.g., Weigel et al. 2017; Kelly & Shen 2013; Schulze et al. 2015). A least-squares fit to observations of the Eddington ratio distribution function (ERDF) of broadline AGN from the SXDS survey over z ∼ 1.4 (Nobuta et al. 2012) favors a lognormal form with the following mean Eddington ratio as a function of LBol:
 (3)
(3)
where  is the mean of the Eddington ratio (expressed in log units) of the sample. From this, the relation between the bolometric luminosity and the black hole mass can be expressed as:
 (4)
(4)
The scatter in the above relation is found to be 0.4 dex, which reflects the distribution of the full width at half maximum (FWHM) of the lognormal distribution (Nobuta et al. 2012).
We can generalize the above expression to high redshifts using the relation between the black hole mass and the host galaxy stellar mass, M*, of the galaxy8, which is constrained from local observations (Kormendy & Ho 2013, see Sect. 6.10 and Eq. (10) of that paper) to have the form:
 (5)
(5)
with an intrinsic scatter of 0.29 dex. The evolution of the black hole mass-stellar mass relation is assumed to follow a (1 + z)2 scaling with redshift. Such an evolution is expected from theoretical arguments based on the black hole mass to halo circular velocity (MBH − vc) relation:  (e.g., Wyithe & Loeb 2002), with vc ∝ (1 + z)1/2, and assuming that the stellar mass to host halo mass relation does not evolve strongly with redshift (Behroozi et al. 2019). The above scaling is borne out by recent observations (e.g., Caplar et al. 2015).
This allows us to express the best-fitting relation Eq. (4) and its associated scatter in terms of the stellar mass and redshift of the host galaxy, with the scatter coming from the combination of that in the LBol − MBH and in the MBH − M* relations.
The expression for Lpeak in Eq. (1) is then given by (e.g., Fialkov & Loeb 2017):
 (6)
(6)
and the rate of TDEs, ΓTDE is given by the observationally motivated fitting form for core-dominated galaxies (e.g., Stone & Metzger 2016):9
 (7)
(7)
We also have:
 (8)
(8)
assuming a solar mass star is totally disrupted, consistently with Eq. (10) of Fialkov & Loeb (2017). Half the mass of the star is assumed to be accreted into the black hole which has a radiative efficiency, ϵ.
Using the above ingredients, Eq. (1) can be recast as:
 (9)
(9)
with ϵ being an adjustable parameter. Figure 1 plots the quantity pTDE(M*, z, ϵ) against Lbol(M*, z), along with the associated scatter, assuming ϵ = 0.1 and for a range of host galaxy stellar masses between {106, 1015}M⊙. The figure shows that for a fixed Lbol, the pTDE is relatively insensitive to z (since it has very little dependence on the black hole mass, MBH, e.g., Merloni et al. 2015). We also note the characteristic drop-off of this function above bolometric luminosities ≳1045 erg s−1, which arises due to the exponential cutoff above LBol ∼ Lpeak that corresponds to black hole masses greater than MBH ∼ 1.2 × 10⁸ M⊙ (e.g., Kesden 2012). The duration, tpeak, as a function of Lbol for these parameters and stellar masses ranges from about 0.1 to a few ten years.
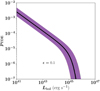 |
Fig. 1. Probability of a TDE, pTDE, arising in AGN as a function of their bolometric luminosity, Lbol for a population having an assumed radiative efficiency ϵ = 0.1. |
3. Fraction of TDEs in AGN
Given the rates for TDEs occurring in AGN as calculated in the previous section, we can now compute the probability of TDEs occuring in different AGN populations in a particular bolometric luminosity interval as a function of redshift. To do this, we use the definition of pAGN used in, e.g., Merloni et al. (2015), which measures the probability of AGN with a specified bolometric luminosity, LBol, arising in host galaxies with a given total stellar mass (M*) at redshift z. This is given by:
 (10)
(10)
The numerator, ϕAGN, in the above expression denotes the AGN luminosity function, which is typically given by a Schechter or double power law form10, e.g., Aird et al. (2015) and shown in the top panel of Fig. 2, with the different colors indicating the various redshifts. The denominator ϕSMF denotes the stellar mass function of the host galaxy, which is a function of the stellar mass and redshift. Using the latest results from the WINGS (at z ∼ 0; Vulcani et al. 2011) and the COSMOS (at z ∼ 0.2 − 5; Davidzon et al. 2017) for the stellar mass function, and the conversion between Lbol and M*(z) (through the MBH − M* relation, as outlined in Sect. 2), we can express the ϕSMF as a function of Lbol. This is illustrated by the curves in the lower panel of Fig. 2. The curves show that the “knee” of the stellar mass function gradually shifts to higher bolometric luminosities at higher redshifts, since a given stellar mass M* corresponds to a larger MBH (and thus a larger LBol) as z increases.
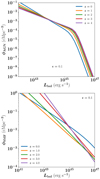 |
Fig. 2. Observed stellar mass and luminosity functions used in this work. Top panel: observed AGN luminosity function, ϕAGN(LBol(M*, z)) at different redshifts from the X-ray data of Aird et al. (2015) and using the bolometric correction of Runnoe et al. (2012) to convert X-ray luminosity to bolometric luminosity. Lower panel: stellar mass functions compiled from the latest WINGS (Vulcani et al. 2011, z ∼ 0) and COSMOS (Davidzon et al. 2017, z ∼ 0.2 − 5) survey data converted into the equivalent ϕSMF(LBol) by using the relation between LBol and M* via MBH. |
At this point, Eqs. (9) and (10) can be used to calculate the fraction of TDE contributing to AGNs as a function of their host halo and galaxy properties:
 (11)
(11)
where the numerator on the right-hand side denotes the probability of TDEs occurring in AGN as calculated in the previous section (Eq. (9)) or, equivalently, the joint probability of TDEs and AGN, and the denominator measures the probability of AGN occurring in host galaxies at different redshifts11. For a fiducial AGN population having ϵ = 0.1, the quantity p(TDE|AGN)(M*, z) is plotted against LBol(M*, z) in Fig. 3.
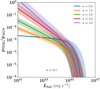 |
Fig. 3. Ratio pTDE/pAGN for an assumed population of AGN having a radiative efficiency ϵ = 0.1, at various redshifts. The shaded areas indicate the uncertainty induced by the scatter in the Lbol − M* relation at various redshifts. |
At low luminosities (LBol ∼ 1043 erg s−1), TDEs may account for a few percent of AGN at z ∼ 0 − 1, which is consistent with observational estimates. However, as Fig. 3 shows, this number could reach a significant fraction of low-luminosity AGN at higher redshifts, which can be tested by future data. We see that TDEs could account for all the AGN seen in the 1041 − 1042 ergs s−1 luminosity regime at z ≳ 3, even with a significant factor “to spare”.
4. TDEs in different AGN populations
Thus far, we have considered the occurrence of TDEs in fiducial AGNs with specified host galaxy properties, which are assumed to be representative of a generic AGN population at various redshifts. Next, we briefly consider the occurence of TDEs in a couple of specific classes of AGN, namely (i) CL AGN (or CLQs; e.g., Yang et al. 2018; MacLeod et al. 2019; Ross et al. 2018; Stern et al. 2018) and (ii) CT AGN (e.g., Baloković et al. 2014; Malizia et al. 2009; Marchesi et al. 2018).
The origin of the so-called “changing look” phenomena in AGN, in which a luminous quasar dims significantly over a timescale of < 10 yrs, is currently unknown. The AGN classified as changing look (CL) have been currently discovered in the local universe up to a highest redshift of z ∼ 2. More than 20% (MacLeod et al. 2019) of quasars with Lbol > 1044 erg s−1, and 30–50% of quasars with Lbol ∼ 1045 − 1047 erg s−1 (Rumbaugh et al. 2018) are found to fall into this category. While several CLQs have Eddington ratios around 0.1 (e.g., Fig. 14 of Graham et al. 2019), in the present study we, assume that the Eddington ratio distribution of the CLQs does not differ from that of the broader AGN population.
We can thus estimate how many of the low-z CLQ discovered so far may be accounted for as TDE flares contributing to AGN. From Fig. 3, we see that at z ∼ 1, a maximum of ∼1% of the AGN with Lbol ≳ 1042 erg s−1 may originate from TDE flares, which thus represent up to about 5% of the observed CLQ abundance12.
On the other hand, at higher redshifts, there is evidence to indicate a much larger fraction of TDE flares contributing to AGN in the CLQ population. The first CLQs at z > 2 that were recently discovered (Ross et al. 2020) have Eddington ratios of η > 0.05. Upcoming experiments such as the Dark Energy Spectroscopic Instrument (DESI; DESI Collaboration 2016) and LSST will enable stringent constraints on this population at higher redshifts. Assuming the intrinsic parameters of the population do not change significantly with redshift, we predict a “TDE luminosity function”, ϕTDE ≡ pTDE × ϕSMF, as shown in Fig. 4. This function provides a lower limit on the abundance of CLQs at high-z whose flares may have an exclusive contribution from TDEs.
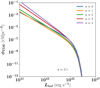 |
Fig. 4. Predicted luminosity function of TDE flares contributing to AGN, ϕTDE ≡ pTDE × ϕSMF, for an assumed population having radiative efficiency ϵ = 0.1. The predicted ϕTDE serves as a lower limit on the luminosity function of changing look quasars, assuming their intrinsic parameters remain redshift independent. |
The discussion of TDEs is of particular interest to CT environments because the TDE debris in tidal streams has a large column density and is naturally Compton-Thick. This population may thus appear as CT AGN; with the thick envelope of gas making them detectable in X-rays but not in optical-UV. Adopting the luminosity function of CT AGN (as a function of the absorbed AGN fraction) from Aird et al. (2015), we calculate the ratio pTDE/pCTAGN, which is plotted in Fig. 5. We find that the TDE fraction in CT AGN can be a few percent around Lbol ∼ 1043 erg s−1 at redshifts of z ∼ 1. At higher redshifts, it may reach a greater (up to several ten percent) fraction of the CT AGN population. In all cases, it drops sharply, as expected, around Lbol ∼ 1046 erg s−1.
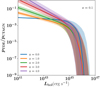 |
Fig. 5. Probability of CT AGN hosting a TDE at various redshifts. The assumed AGN population has a radiative efficiency of ϵ = 0.1. The shaded areas indicate the uncertainty induced by the scatter in the Lbol − M* relation at various redshifts. |
5. Discussion
Here, we have considered the fraction of AGN that may arise from tidal disruption events (TDEs) at low and high redshifts. In so doing, we have extended the locally observed relations connecting the rates of TDEs to the BH host masses of the AGN through their bolometric luminosities (Nobuta et al. 2012; Kormendy & Ho 2013) to high redshifts using the inferred evolution of the black hole mass to the host galaxy stellar mass relation (Caplar et al. 2015; Wyithe & Loeb 2002). Combining these findings with the observationally derived galaxy luminosity function (Vulcani et al. 2011; Davidzon et al. 2017), we have estimated the fraction of TDEs occurring in different AGN populations. For a fiducial AGN population having an average radiative efficiency of ϵ = 0.1, we find that TDEs are able to account for a few percent of all AGN with bolometric luminosities LBol ≳ 1042 erg s−1 at z ∼ 1, but may reach several tens of percent at z ≳ 3.
It is also of interest to explore to what extent specific AGN populations are likely to be the result of TDE flares at low and high redshifts. Two examples of such populations are the so-called CL AGN (or CLQs) and Compton-Thick AGN (or CT AGN). On applying the above formalism to these populations, we found that a maximum of about a few percent of the observed CLQ AGN (having LBol > 1042 erg s−1) may be consistent with a TDE contribution to their origin at z ∼ 1, although this fraction may increase rapidly at higher redshifts, to several tens of percent at z ≳ 3. We also find that in the TDE fraction may be about a few percent of CT AGN with LBol ≳ 1043 erg s−1 at redshifts z < 1, but may again account for up to several ten percent of this population at z ≳ 3.
In Fig. 10 of Lanzuisi et al. (2018), an analysis of CT AGN carried out from the Chandra-COSMOS legacy survey shows that the fraction of CT AGN increases with increasing redshifts, and the merger fraction in CT AGN increases with increasing luminosities and redshifts. Interestingly, a sharp rise in the “fraction of merged or disturbed morphology” in these AGN occurs above LBol > 1046 erg s−1. This may be attributable to the non-TDE triggered AGN being triggered primarily by mergers, with the merger fraction increasing sharply once the maximum black hole mass of 108 M⊙ is reached, consistently with our results in Fig. 5.
Throughout the analysis, we have considered various sources of scatter in the in the adopted relations. The average trend between the bolometric luminosity and the black hole mass contains an associated scatter, which is estimated directly from the observations (Nobuta et al. 2012). This scatter is added to that in the relation connecting the black hole mass and host galaxy stellar mass (Kormendy & Ho 2013). A source of scatter we have not taken into account is that coming from the bolometric correction, which may have an uncertainty of about 15–20% (Runnoe et al. 2012). However, we note that this uncertainty is chiefly driven by our knowledge of the bolometric correction, rather than an intrinsic scatter due to physical processes.
A caveat to the analysis here is that it is not presently clear whether the black hole-galaxy correlations are valid for less massive galaxies (with MBH below 109 M⊙) at z ∼ 0 (e.g., Shirakata et al. 2017; Nguyen et al. 2020) due to the lack of understanding of seed black holes. The occupation fraction of black holes in less massive galaxies, if lower than the average (e.g., Volonteri et al. 2008; Volonteri 2010; Greene 2012) would influence the TDE detection rate and therefore the TDE fraction in AGN. The black hole-galaxy stellar mass connections may also have an evolutionary dependence weaker than the currently employed (1 + z)2, although this remains a point of active debate.
The present analysis assumes that the intrinsic per-galaxy TDE rate (given by Eq. (7)) remains roughly constant across redshifts. While observations of TDEs have found rates of 10−5 TDEs per year per galaxy in samples out to redshift z ∼ 0.4 (French et al. 2020), this is still an order of magnitude smaller than that predicted by theoretical models (e.g., Kochanek 2016; Stone & Metzger 2016). The above findings also illustrate that the detection of TDEs in high-redshift AGN can place constraints on the black hole mass function and its evolution assumed by the theoretical models (e.g., Hopkins et al. 2007), including the consequences of mergers (Shankar et al. 2009).
Our results serve as a useful benchmark for calibrating future simulations of the physical processes giving rise to TDEs in AGN at high redshifts and their inferred contributions in various AGN populations. Current and future surveys, for instance, the Athena13 and Lynx14 missions that target different AGN populations will be able to place stringent constraints on the CT AGN fractions at high redshifts, and combining this data with the findings of spectroscopic surveys such as the LSST and DESI will allow us to better quantify the contributions of TDEs as AGN at these epochs. The above formalism will in turn enable the most precise constraints thus far on the evolution of the central black hole-halo mass relation of the host galaxies at high redshifts. Furthermore, future detections of TDEs will unveil the as-yet poorly understood processes governing the growth of IMBHs and SMBHs, whose mergers are expected to constitute the primary gravitational wave event triggers detectable by the forthcoming LISA observatory.
A fully general relativistic calculation finds that the maximum mass required for tidal disruption to occur (Hills 1975) is about a few times 108 M⊙ for a spinning black hole, compared to about a few times 107 M⊙ obtained by analytical calculations for non-spinning black holes (e.g., Rossi et al. 2020).
A live catalog of observed TDE events is provided in https://tde.space/statistics/host-galaxies/.
We use the standard power-law decline here (e.g., Evans & Kochanek 1989), although we note that this can be a function of time and stellar structure (e.g., Auchettl et al. 2017).
We note that we follow Kormendy & Ho (2013) in ignoring the distinction between the bulge and total stellar mass when considering the evolution in a statistical sense.
We are making the implicit assumption that the TDE rate is influenced by physical processes that are not expected to change with redshift. The latest compilations connecting TDE rates to their observed host galaxy properties (e.g., French et al. 2020) find that a TDE rate of ∼10−5 per year per galaxy is well borne out by recent data.
The X-ray luminosity for 2–10 keV is converted to bolometric luminosity by using the bolometric correction log LX = (log Lbol − 23.04)/0.52 from Runnoe et al. (2012).
We note that this makes the implicit assumption that SMBH accrete with the same efficiency in the TDE and the non-TDE – i.e., when fed by long-term gas accretion from the ISM – phase. While this may not be strictly true in general, it is the simplest possible scenario consistent with the available data, when taking into account that the exact value of the accretion efficiency does not change the results significantly.
The tpeak timescales for the Lbol values considered here range from about 0.1 to a few ten years over z ∼ 0 − 4, which are broadly consistent with the changing-look timescales expected from the literature.
Acknowledgments
HP acknowledges support by the Swiss National Science Foundation (SNSF) Ambizione Grant PZ00P2_179934 “Probing the Universe: through reionization and beyond”. The work of AL was supported in part by the Black Hole Initiative at Harvard University, which is funded by grants from the JTF and GBMF.
References
- Aird, J., Coil, A. L., Georgakakis, A., et al. 2015, MNRAS, 451, 1892 [Google Scholar]
- Alexander, T., & Bar-Or, B. 2017, Nat. Astron., 1, 0147 [NASA ADS] [CrossRef] [Google Scholar]
- Alexander, K. D., van Velzen, S., Horesh, A., & Zauderer, B. A. 2020, Space Sci. Rev., 216, 81 [CrossRef] [Google Scholar]
- Auchettl, K., Guillochon, J., & Ramirez-Ruiz, E. 2017, ApJ, 838, 149 [Google Scholar]
- Baloković, M., Comastri, A., Harrison, F. A., et al. 2014, ApJ, 794, 111 [CrossRef] [Google Scholar]
- Behroozi, P., Wechsler, R. H., Hearin, A. P., & Conroy, C. 2019, MNRAS, 488, 3143 [NASA ADS] [CrossRef] [Google Scholar]
- Bloom, J. S., Giannios, D., Metzger, B. D., et al. 2011, Science, 333, 203 [CrossRef] [PubMed] [Google Scholar]
- Caplar, N., Lilly, S. J., & Trakhtenbrot, B. 2015, ApJ, 811, 148 [NASA ADS] [CrossRef] [Google Scholar]
- Cenko, S. B., Krimm, H. A., Horesh, A., et al. 2012, ApJ, 753, 77 [NASA ADS] [CrossRef] [Google Scholar]
- Davidzon, I., Ilbert, O., Laigle, C., et al. 2017, A&A, 605, A70 [NASA ADS] [CrossRef] [EDP Sciences] [Google Scholar]
- DESI Collaboration (Aghamousa, A., et al.) 2016, ArXiv e-prints [arXiv:1611.00036] [Google Scholar]
- Evans, C. R., & Kochanek, C. S. 1989, ApJ, 346, L13 [Google Scholar]
- Fialkov, A., & Loeb, A. 2017, MNRAS, 471, 4286 [NASA ADS] [CrossRef] [Google Scholar]
- French, K. D., Wevers, T., Law-Smith, J., Graur, O., & Zabludoff, A. I. 2020, Space Sci. Rev., 216, 1 [Google Scholar]
- Gezari, S., Chornock, R., Rest, A., et al. 2012, Nature, 485, 217 [Google Scholar]
- Graham, A. W. 2016, in Galaxy Bulges and Their Massive Black Holes: A Review, eds. E. Laurikainen, R. Peletier, & D. Gadotti, Astrophys. Space Sci. Libr., 418, 263 [NASA ADS] [Google Scholar]
- Graham, M. J., Ross, N. P., Stern, D., et al. 2019, MNRAS, 491, 4925 [Google Scholar]
- Greene, J. E. 2012, Nat. Commun., 3, 1304 [NASA ADS] [CrossRef] [Google Scholar]
- Guillochon, J., & Ramirez-Ruiz, E. 2015, ApJ, 809, 166 [Google Scholar]
- Hills, J. G. 1975, Nature, 254, 295 [Google Scholar]
- Hopkins, P. F., Richards, G. T., & Hernquist, L. 2007, ApJ, 654, 731 [Google Scholar]
- Kara, E., Miller, J. M., Reynolds, C., & Dai, L. 2016, Nature, 535, 388 [NASA ADS] [CrossRef] [Google Scholar]
- Kelly, B. C., & Shen, Y. 2013, ApJ, 764, 45 [NASA ADS] [CrossRef] [Google Scholar]
- Kesden, M. 2012, Phys. Rev. D, 85, 024037 [NASA ADS] [CrossRef] [Google Scholar]
- Kochanek, C. S. 2016, MNRAS, 461, 371 [NASA ADS] [CrossRef] [Google Scholar]
- Kormendy, J., & Ho, L. C. 2013, ARA&A, 51, 511 [Google Scholar]
- Lanzuisi, G., Civano, F., Marchesi, S., et al. 2018, MNRAS, 480, 2578 [Google Scholar]
- Levan, A. J., Tanvir, N. R., Cenko, S. B., et al. 2011, Science, 333, 199 [NASA ADS] [CrossRef] [Google Scholar]
- LIGO Scientific Collaboration,& Virgo Collaboration 2020a, Phys. Rev. Lett., 125, 101102 [Google Scholar]
- LIGO Scientific Collaboration,& Virgo Collaboration 2020b, ApJ, 900, L13 [NASA ADS] [CrossRef] [Google Scholar]
- Loeb, A., & Ulmer, A. 1997, ApJ, 489, 573 [Google Scholar]
- MacLeod, C. L., Green, P. J., Anderson, S. F., et al. 2019, ApJ, 874, 8 [Google Scholar]
- Malizia, A., Stephen, J. B., Bassani, L., et al. 2009, MNRAS, 399, 944 [NASA ADS] [CrossRef] [Google Scholar]
- Marchesi, S., Ajello, M., Marcotulli, L., et al. 2018, ApJ, 854, 49 [Google Scholar]
- Martini, P. 2004, in The Interplay Among Black Holes, Stars and ISM in Galactic Nuclei, eds. T. Storchi-Bergmann, L. C. Ho, & H. R. Schmitt, IAU Symp., 222, 235 [NASA ADS] [Google Scholar]
- Merloni, A., Dwelly, T., Salvato, M., et al. 2015, MNRAS, 452, 69 [Google Scholar]
- Nguyen, D. D., den Brok, M., Seth, A. C., et al. 2020, ApJ, 892, 68 [NASA ADS] [CrossRef] [Google Scholar]
- Nobuta, K., Akiyama, M., Ueda, Y., et al. 2012, ApJ, 761, 143 [NASA ADS] [CrossRef] [Google Scholar]
- Rees, M. J. 1988, Nature, 333, 523 [Google Scholar]
- Ross, N. P., Ford, K. E. S., Graham, M., et al. 2018, MNRAS, 480, 4468 [Google Scholar]
- Ross, N. P., Graham, M. J., Calderone, G., et al. 2020, MNRAS, 498, 2339 [NASA ADS] [CrossRef] [Google Scholar]
- Rossi, E. M., Stone, N. C., Law-Smith, J. A. P., et al. 2020, ArXiv e-prints [arXiv:2005.12528] [Google Scholar]
- Rumbaugh, N., Shen, Y., Morganson, E., et al. 2018, ApJ, 854, 160 [NASA ADS] [CrossRef] [Google Scholar]
- Runnoe, J. C., Brotherton, M. S., & Shang, Z. 2012, MNRAS, 422, 478 [Google Scholar]
- Sakurai, Y., Yoshida, N., & Fujii, M. S. 2019, MNRAS, 484, 4665 [Google Scholar]
- Schulze, A., Bongiorno, A., Gavignaud, I., et al. 2015, MNRAS, 447, 2085 [NASA ADS] [CrossRef] [Google Scholar]
- Shankar, F., Weinberg, D. H., & Miralda-Escudé, J. 2009, ApJ, 690, 20 [CrossRef] [Google Scholar]
- Shirakata, H., Kawaguchi, T., Okamoto, T., & Ishiyama, T. 2017, Front. Astron. Space Sci., 4, 13 [NASA ADS] [CrossRef] [Google Scholar]
- Stern, D., McKernan, B., Graham, M. J., et al. 2018, ApJ, 864, 27 [Google Scholar]
- Stone, N., & Loeb, A. 2011, MNRAS, 412, 75 [NASA ADS] [CrossRef] [Google Scholar]
- Stone, N., & Loeb, A. 2012, MNRAS, 422, 1933 [NASA ADS] [CrossRef] [Google Scholar]
- Stone, N. C., & Metzger, B. D. 2016, MNRAS, 455, 859 [NASA ADS] [CrossRef] [Google Scholar]
- Strubbe, L. E., & Quataert, E. 2009, MNRAS, 400, 2070 [NASA ADS] [CrossRef] [Google Scholar]
- van Velzen, S., Körding, E., & Falcke, H. 2011, MNRAS, 417, L51 [NASA ADS] [Google Scholar]
- van Velzen, S., Gezari, S., Hammerstein, E., et al. 2021, ApJ, 908, 4 [NASA ADS] [CrossRef] [Google Scholar]
- Volonteri, M. 2010, A&ARv, 18, 279 [Google Scholar]
- Volonteri, M., Lodato, G., & Natarajan, P. 2008, MNRAS, 383, 1079 [Google Scholar]
- Vulcani, B., Poggianti, B. M., Aragón-Salamanca, A., et al. 2011, MNRAS, 412, 246 [Google Scholar]
- Weigel, A. K., Schawinski, K., Caplar, N., et al. 2017, ApJ, 845, 134 [NASA ADS] [CrossRef] [Google Scholar]
- Wyithe, J. S. B., & Loeb, A. 2002, ApJ, 581, 886 [NASA ADS] [CrossRef] [Google Scholar]
- Yang, Q., Wu, X.-B., Fan, X., et al. 2018, ApJ, 862, 109 [Google Scholar]
All Figures
|
Fig. 1. Probability of a TDE, pTDE, arising in AGN as a function of their bolometric luminosity, Lbol for a population having an assumed radiative efficiency ϵ = 0.1. |
| In the text | |
|
Fig. 2. Observed stellar mass and luminosity functions used in this work. Top panel: observed AGN luminosity function, ϕAGN(LBol(M*, z)) at different redshifts from the X-ray data of Aird et al. (2015) and using the bolometric correction of Runnoe et al. (2012) to convert X-ray luminosity to bolometric luminosity. Lower panel: stellar mass functions compiled from the latest WINGS (Vulcani et al. 2011, z ∼ 0) and COSMOS (Davidzon et al. 2017, z ∼ 0.2 − 5) survey data converted into the equivalent ϕSMF(LBol) by using the relation between LBol and M* via MBH. |
| In the text | |
|
Fig. 3. Ratio pTDE/pAGN for an assumed population of AGN having a radiative efficiency ϵ = 0.1, at various redshifts. The shaded areas indicate the uncertainty induced by the scatter in the Lbol − M* relation at various redshifts. |
| In the text | |
|
Fig. 4. Predicted luminosity function of TDE flares contributing to AGN, ϕTDE ≡ pTDE × ϕSMF, for an assumed population having radiative efficiency ϵ = 0.1. The predicted ϕTDE serves as a lower limit on the luminosity function of changing look quasars, assuming their intrinsic parameters remain redshift independent. |
| In the text | |
|
Fig. 5. Probability of CT AGN hosting a TDE at various redshifts. The assumed AGN population has a radiative efficiency of ϵ = 0.1. The shaded areas indicate the uncertainty induced by the scatter in the Lbol − M* relation at various redshifts. |
| In the text | |
Current usage metrics show cumulative count of Article Views (full-text article views including HTML views, PDF and ePub downloads, according to the available data) and Abstracts Views on Vision4Press platform.
Data correspond to usage on the plateform after 2015. The current usage metrics is available 48-96 hours after online publication and is updated daily on week days.
Initial download of the metrics may take a while.