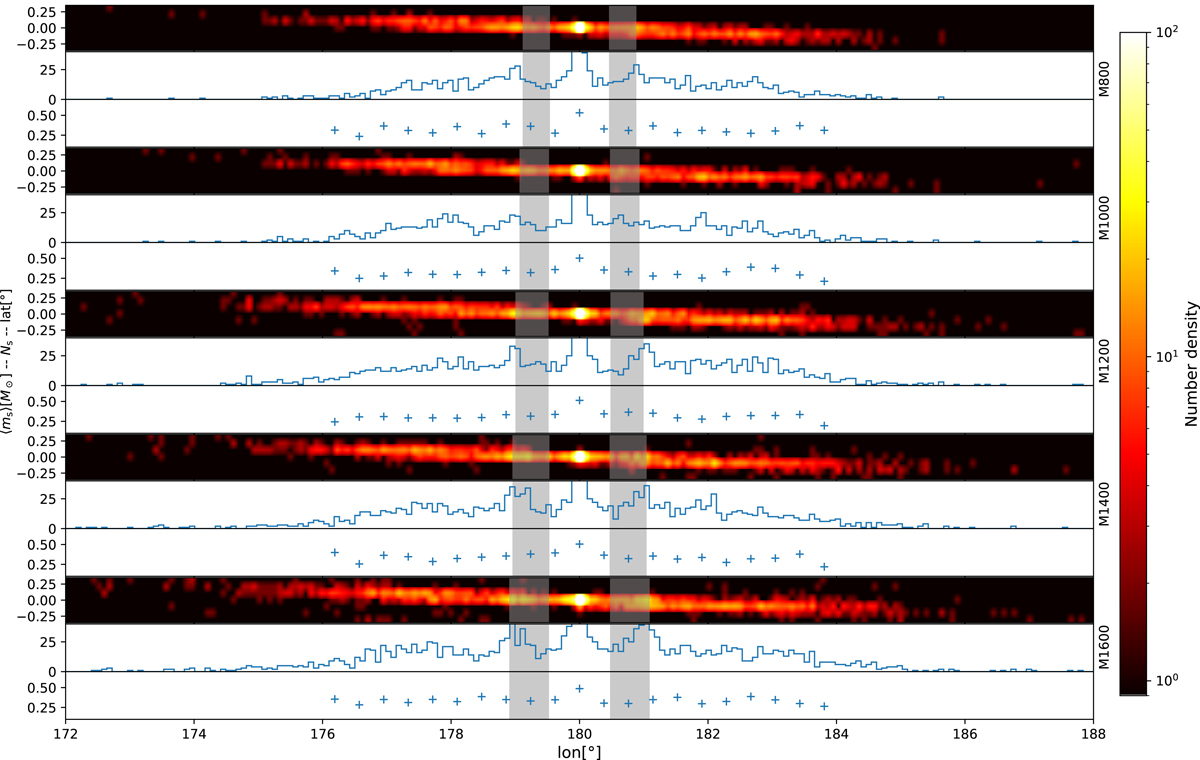
Fig. 8.
Download original image
Comparison of the morphology, density, and average mass of stars for the five models with different M0 and the minimum Δ referring to the OB-min model in the M800R2 set. For each model, the three panels show the number density map of stars in the spherical coordinate system of the Galactocentric reference frame, the histogram of star counting (Ns), and the average mass of stars (⟨ms⟩) along the longitude, respectively. The compacted objects (WDs, NSs, and BHs) are excluded.
Current usage metrics show cumulative count of Article Views (full-text article views including HTML views, PDF and ePub downloads, according to the available data) and Abstracts Views on Vision4Press platform.
Data correspond to usage on the plateform after 2015. The current usage metrics is available 48-96 hours after online publication and is updated daily on week days.
Initial download of the metrics may take a while.