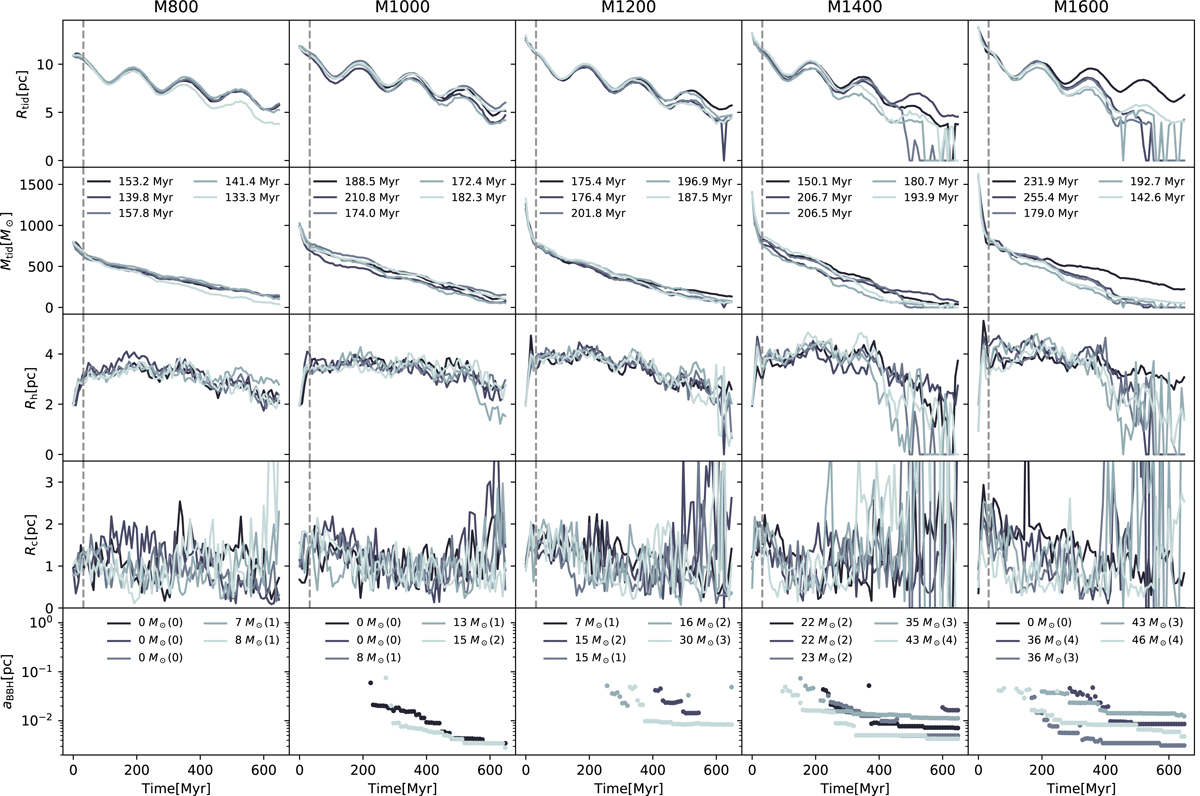
Fig. 7.
Download original image
Evolution of the global properties. From the top to bottom: Rtid, Mtid, Rh, Rc, and aBBH, for the models with similar properties at 32 Myr to those in the OB-max model. The columns separate the models with different M0. For each M0, a brighter color indicates a higher total mass of BHs (MBH). The half-mass relaxation times (Trh) at 32 Myr are shown in the second row of panels. The values of MBH and the corresponding numbers of BHs (in brackets) are shown in the last row of panels.
Current usage metrics show cumulative count of Article Views (full-text article views including HTML views, PDF and ePub downloads, according to the available data) and Abstracts Views on Vision4Press platform.
Data correspond to usage on the plateform after 2015. The current usage metrics is available 48-96 hours after online publication and is updated daily on week days.
Initial download of the metrics may take a while.