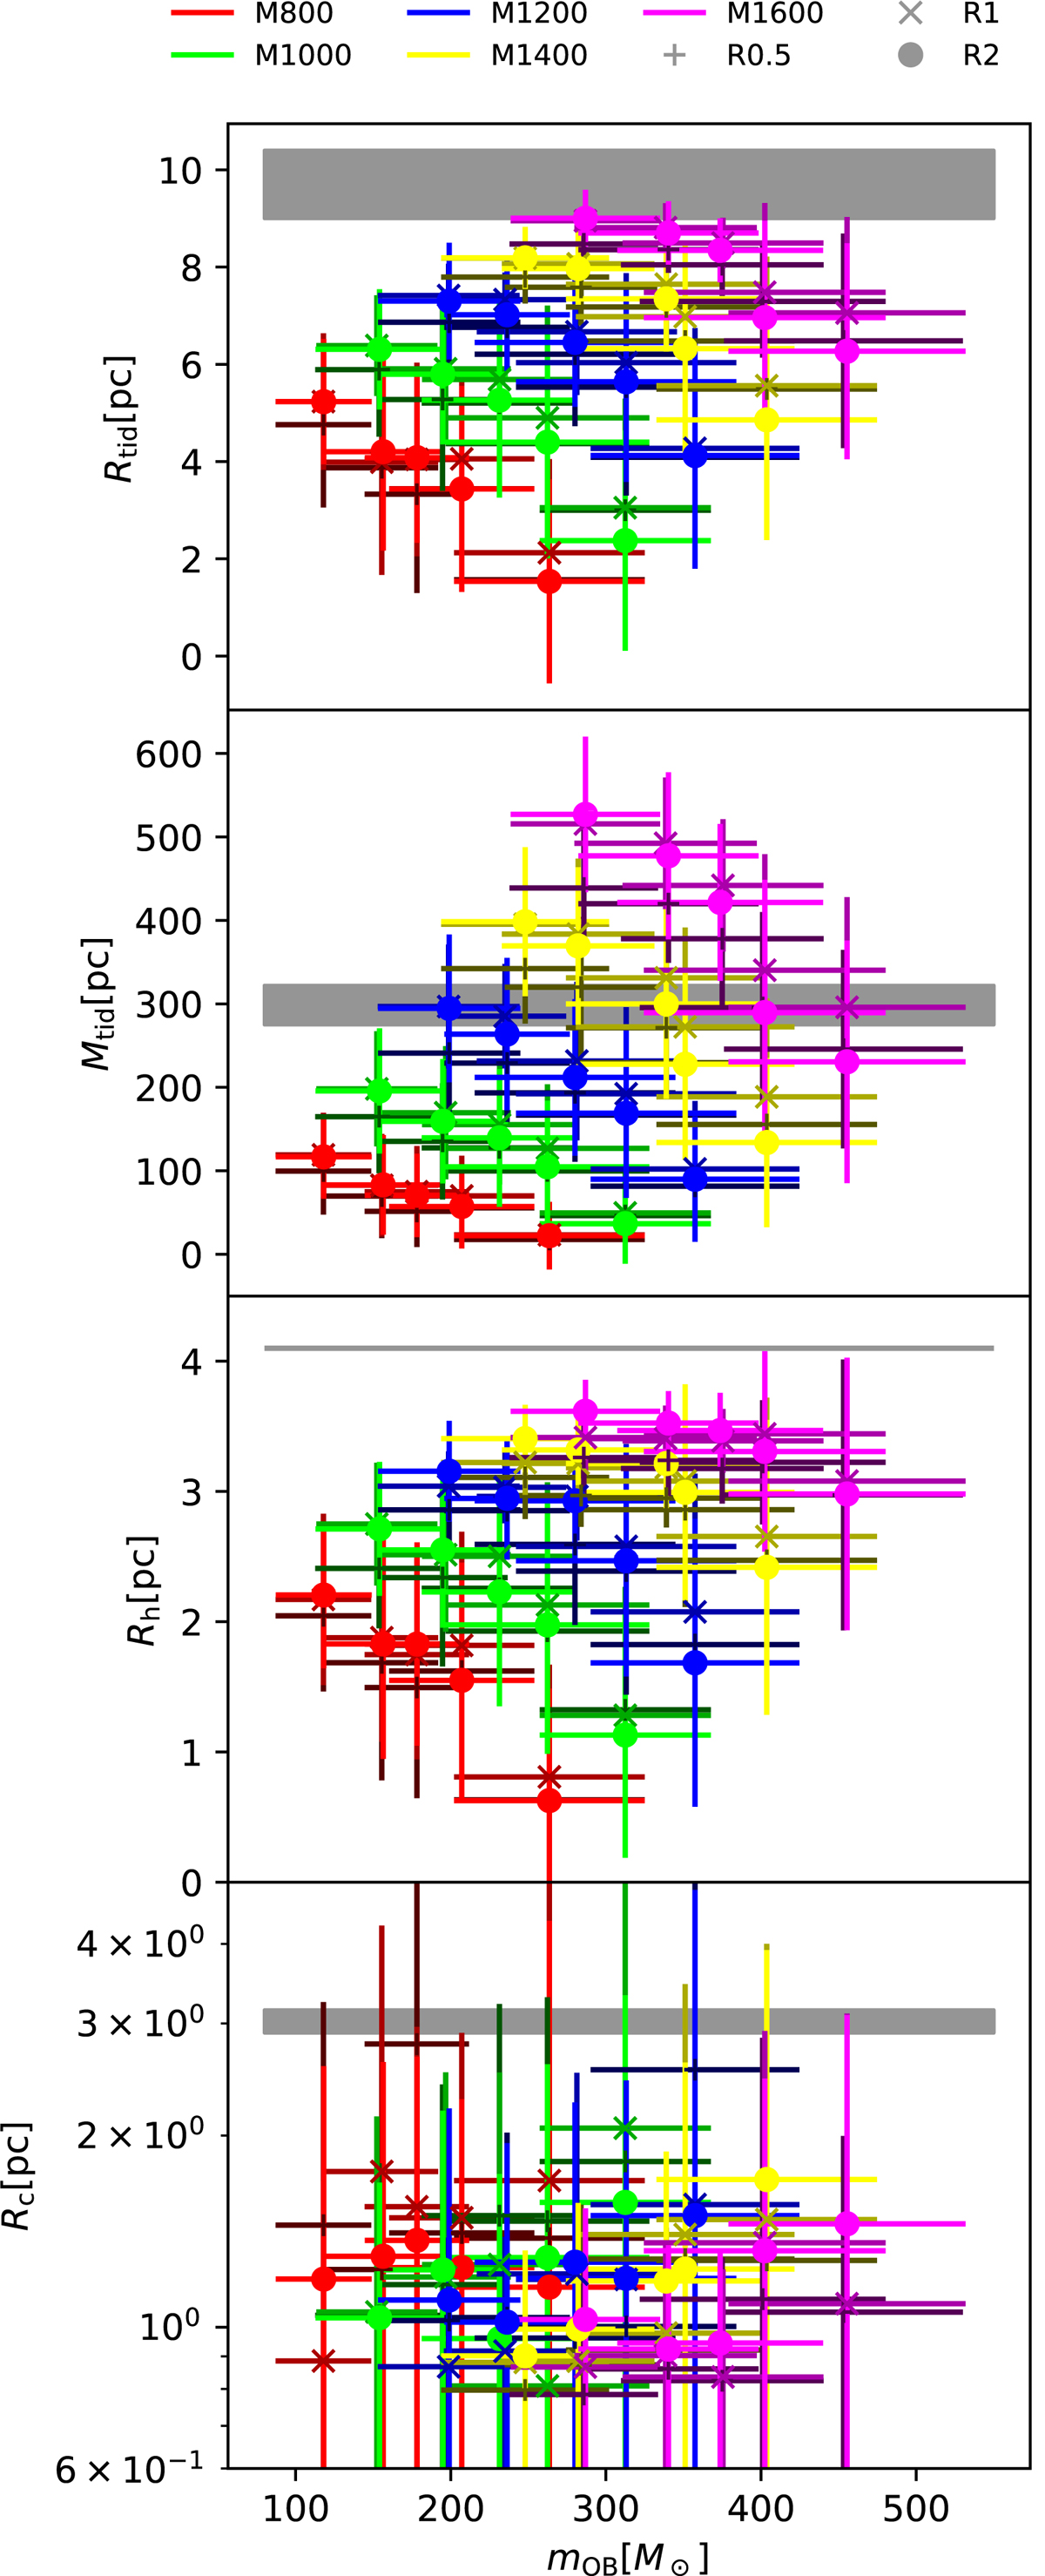
Fig. 6.
Download original image
Comparison of the evolution of the global properties for all models with different M0 (represented by colors) and different Rh, 0 (represented by markers and brightness of colors). From the top to the bottom: Rtid, Mtid, Rh, and Rc. The 300 models in each set are collected into bins of MOB. The error bars represent the standard deviation. The observed values of Hyades are shown as horizontal lines or regions (with uncertainties).
Current usage metrics show cumulative count of Article Views (full-text article views including HTML views, PDF and ePub downloads, according to the available data) and Abstracts Views on Vision4Press platform.
Data correspond to usage on the plateform after 2015. The current usage metrics is available 48-96 hours after online publication and is updated daily on week days.
Initial download of the metrics may take a while.