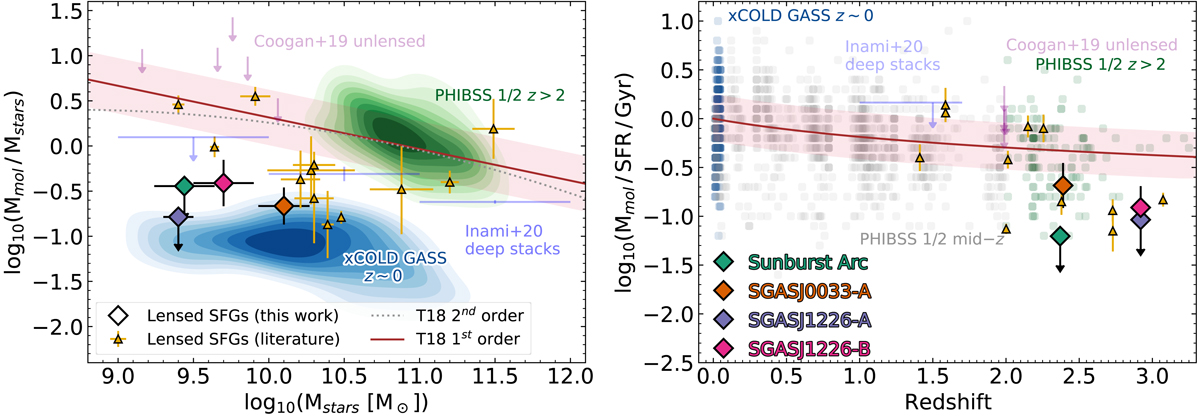
Fig. 7.
Download original image
Molecular gas fraction and depletion timescale (Mmol/SFR) in the context of high and low redshift galaxies. We only show our values based on the 870 μm band continuum as a tracer of Mmol, since it has the highest sensitivity and shows remarkable agreement with the CO-based values (see Fig. 5). The only exception is SGASJ0033-A for which we plot the CO-based value. Left: the filled green (blue) contours show the locus of the Gaussian kernel density estimator for the PHIBSS 1/2 z > 2 (xCOLD GASS) sample. Squares indicate the location of the lensed galaxies presented in this paper, identified by color in the right panel. We also include the joint sample from DZ15 and S13 as orange filled triangles. The brown solid and gray dotted lines show the Tacconi et al. (2018) scaling relation at z = 2.5 using the first and second order fits respectively. Pink downward arows at the top left are the upper limits from the CO nondetections presented in Coogan et al. (2019), while the pale blue errorbars are the result of deep CO stacking in the Hubble Ultra Deep Field with 1.0 < zspec < 1.7 in bins of one dex in Mstars (Inami et al. 2020, the bin with 8 < log10(Mstars/M⊙) < 9 is not shown). Right: gas depletion time versus redshift. The solid brown line is the T18 scaling relation for galaxies with Mstars = 109.7 M⊙, the median mass of our sample. PHIBSS 1/2 data is displayed as shaded circles instead of contours, but the darkness of each circle is a proxy of the number density. Again, the lensed sources studied here fall below the expected relation. The stacked upper limit from Inami et al. (2020) is also shown, and corresponds to the Mstars bin between 109 M⊙ and 1010 M⊙.
Current usage metrics show cumulative count of Article Views (full-text article views including HTML views, PDF and ePub downloads, according to the available data) and Abstracts Views on Vision4Press platform.
Data correspond to usage on the plateform after 2015. The current usage metrics is available 48-96 hours after online publication and is updated daily on week days.
Initial download of the metrics may take a while.