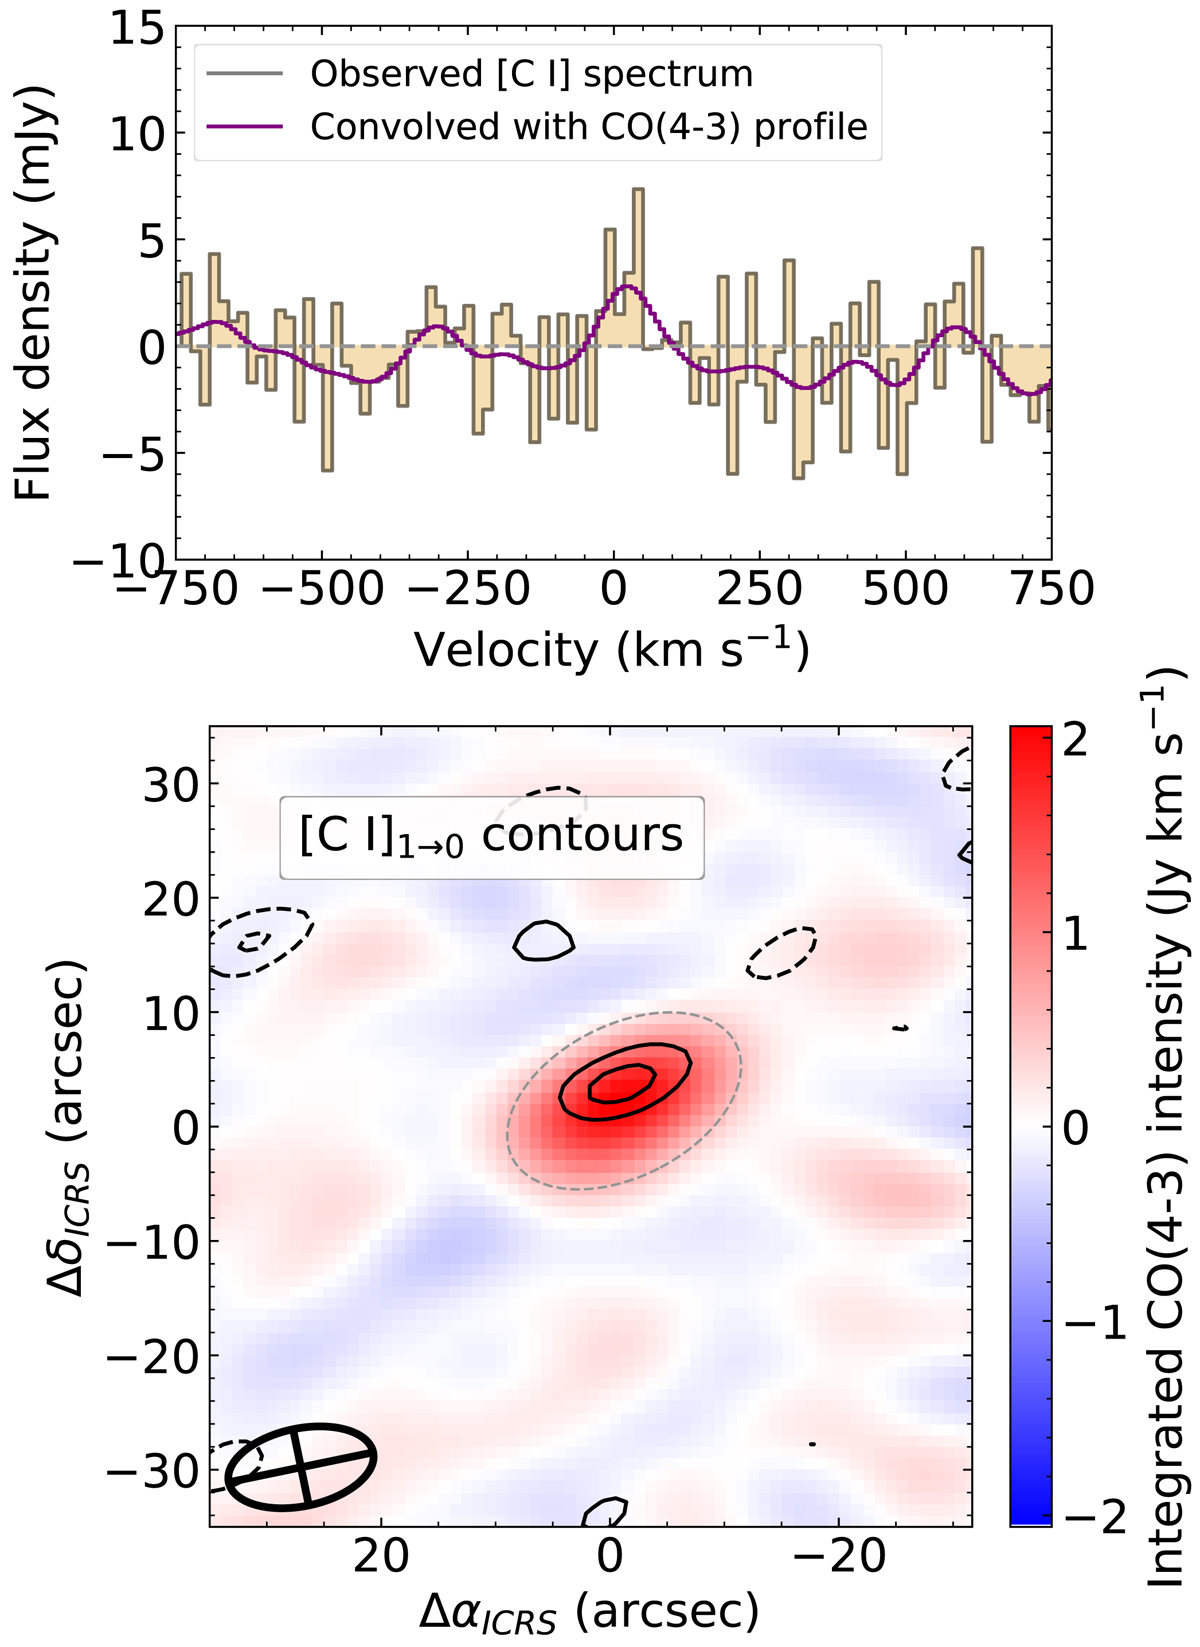
Fig. 3.
Download original image
ACA Detection of [C I]1 → 0 at z = 2.39 toward the lensed galaxy SGASJ0033-A. Upper panel: continuum subtracted spectrum at 145 GHz extracted from the A.1+A.2 aperture (dashed gray line in lower panel) with 2 channel binning (gray line). The overlaid purple curve is the result of the convolution between the observed spectrum and a Gaussian kernel with FWHM equal to the best fit value of the 12CO(4 → 3) line. The velocity axis is centered at the redshift of 12CO(4 → 3). Lower panel: integrated [C I] emission contours (black solid/dahsed curves) at the ±2, 3σ levels on top of the 12CO(4 → 3) moment map. The crossed ellipse at the lower left corner indicates the size and orientation of the [C I] beam.
Current usage metrics show cumulative count of Article Views (full-text article views including HTML views, PDF and ePub downloads, according to the available data) and Abstracts Views on Vision4Press platform.
Data correspond to usage on the plateform after 2015. The current usage metrics is available 48-96 hours after online publication and is updated daily on week days.
Initial download of the metrics may take a while.