Fig. 2.
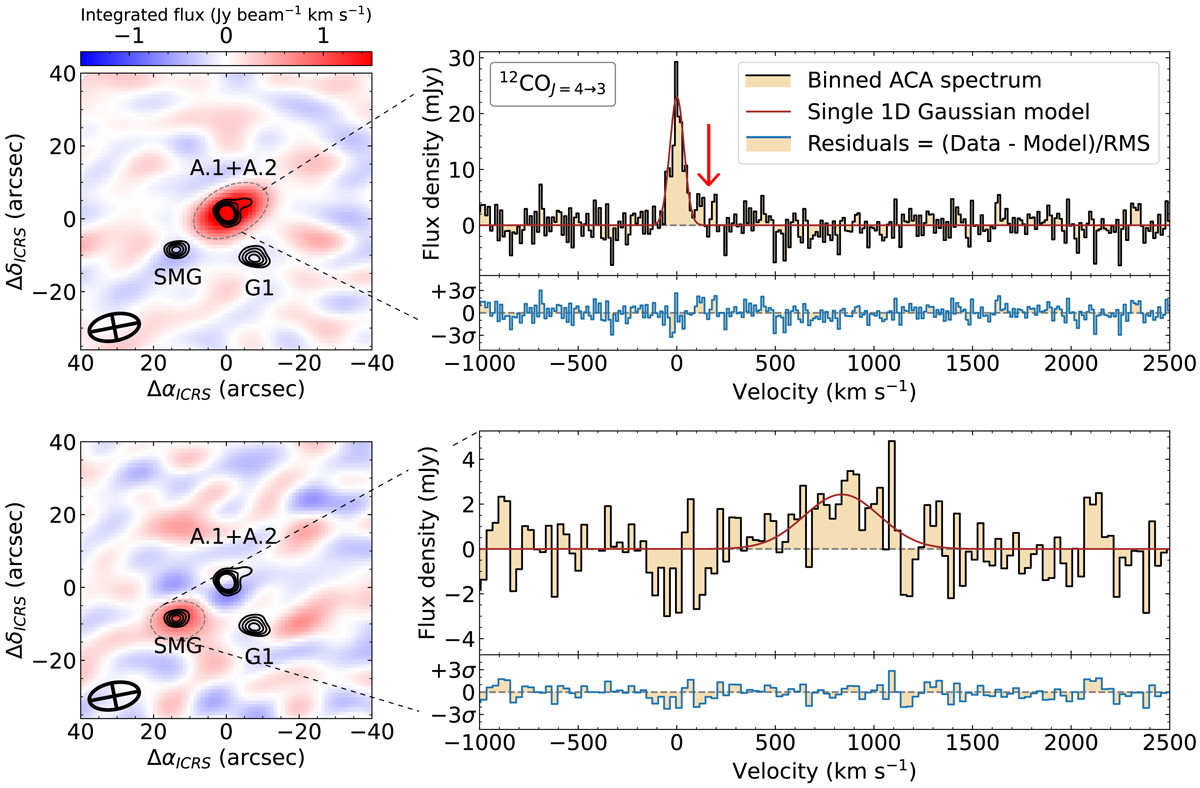
Download original image
Zeroth moment maps and spectra of the emission lines detected in Band 4 toward SGASJ0033. The upper panels show the integrated brightness map of the 12CO(4 → 3) line (left) and its spectral profile (right) observed over images 1 and 2 of the lensed galaxy SGASJ0033-A at z = 2.39. Black contours in both the upper left and lower left panels indicate the positive 870 μm continuum emission above 3σ already shown in Fig. 1. The black crossed ellipses indicate the size of the synthesized beam while the gray dashed ellipses show the apertures used for extracting the spectra shown in the corresponding right panel. The spectrum of 12CO(4 → 3) at A.1+A.2 (upper right panel) was resampled to a channel width of 12.5 km s−1; its best single Gaussian fit (see main text) is displayed in a red solid line. A tentative excess of emission at 150 km s−1 is highlighted by a red vertical arrow. Normalized residuals from the difference between the observed spectrum and the model are shown in blue in the subplot below. The lower panels show the moment map (left) and spectrum (right) of the serendipitous emission line which we associate to the SMG. The channel width was resampled to 30 km s−1 in order to maximize signal-to-noise while keeping five channels per FWHM. The spectral axis is in the same velocity frame as the spectrum of A.1+A.2 (νrest = 135.996 GHz). This choice highlights the proximity in velocity space of the two lines.
Current usage metrics show cumulative count of Article Views (full-text article views including HTML views, PDF and ePub downloads, according to the available data) and Abstracts Views on Vision4Press platform.
Data correspond to usage on the plateform after 2015. The current usage metrics is available 48-96 hours after online publication and is updated daily on week days.
Initial download of the metrics may take a while.