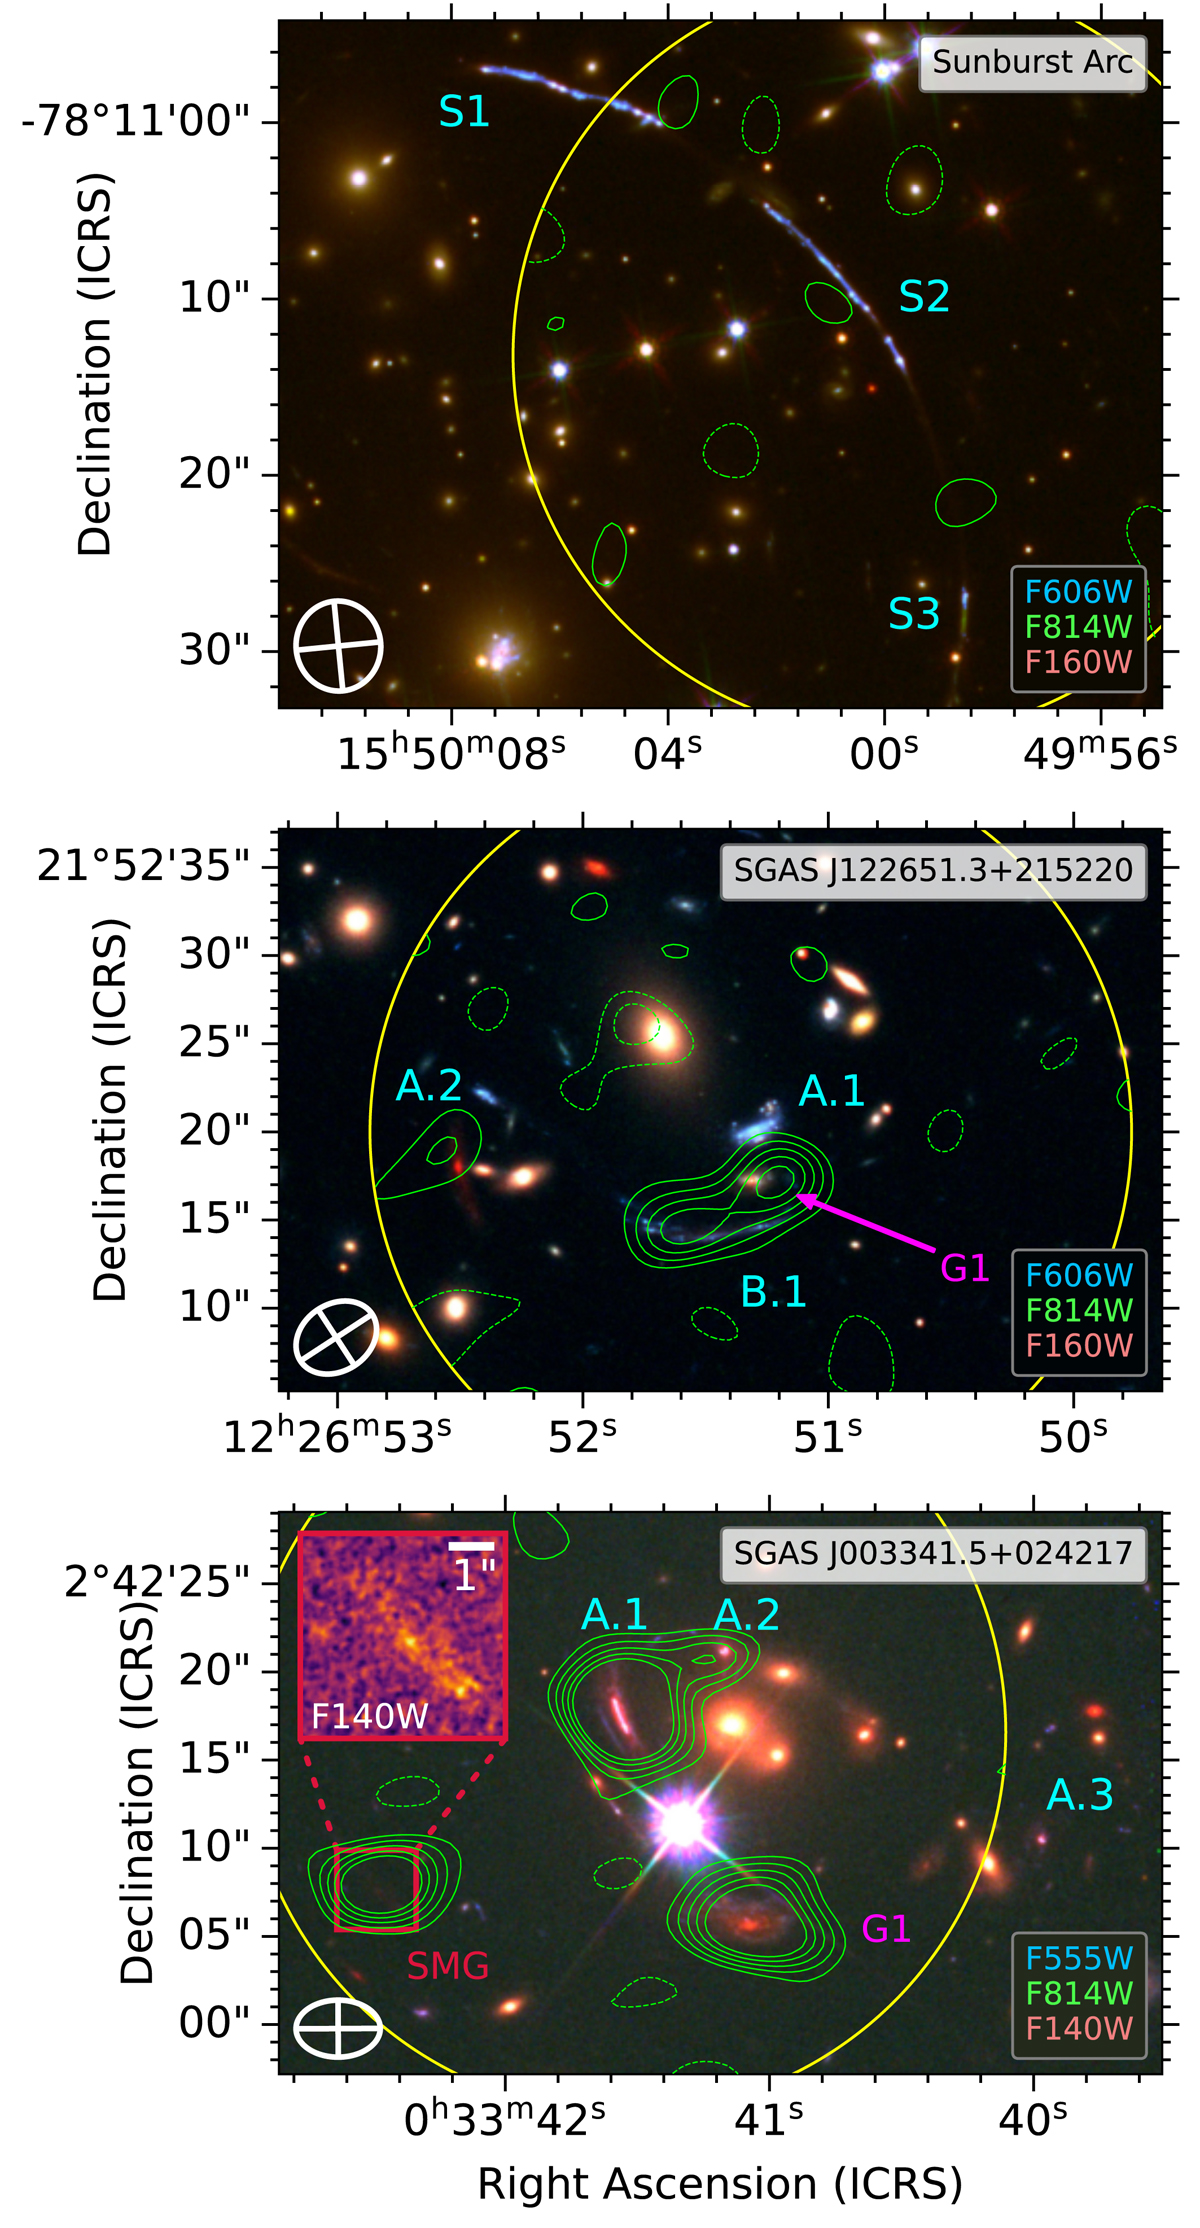
Fig. 1.
Download original image
Band 7 continuum contours for the three ACA pointings in this study on top of their respective HST color images. In all three panels, green solid (dashed) lines indicate positive (negative) contours of 870 μm imaging at the ±2, 3, 4, 5, 6σ levels. The yellow circle indicates the 20% sensitivity cut-off of the antenna primary beam. The white crossed ellipses at the lower left corners show the size of the synthesized beams. Upper panel: no significant detections are obtained within ACA data. Middle panel: two blobs of unambiguous emission are detected toward the center of the ACA beam, roughly cospatial with G1 and B1. Lower panel: four bright sources are detected at λ = 870 μm. Three of them are associated with A.1, A.2 and G1 respectively whereas the fourth source to the east is a previously unreported source (SMG). The inset shows a close-up view of a possible counterpart of the SMG in the WFC3-IR-F140W image (see Sect. 2.2.3).
Current usage metrics show cumulative count of Article Views (full-text article views including HTML views, PDF and ePub downloads, according to the available data) and Abstracts Views on Vision4Press platform.
Data correspond to usage on the plateform after 2015. The current usage metrics is available 48-96 hours after online publication and is updated daily on week days.
Initial download of the metrics may take a while.