Fig. 1.
Download original image
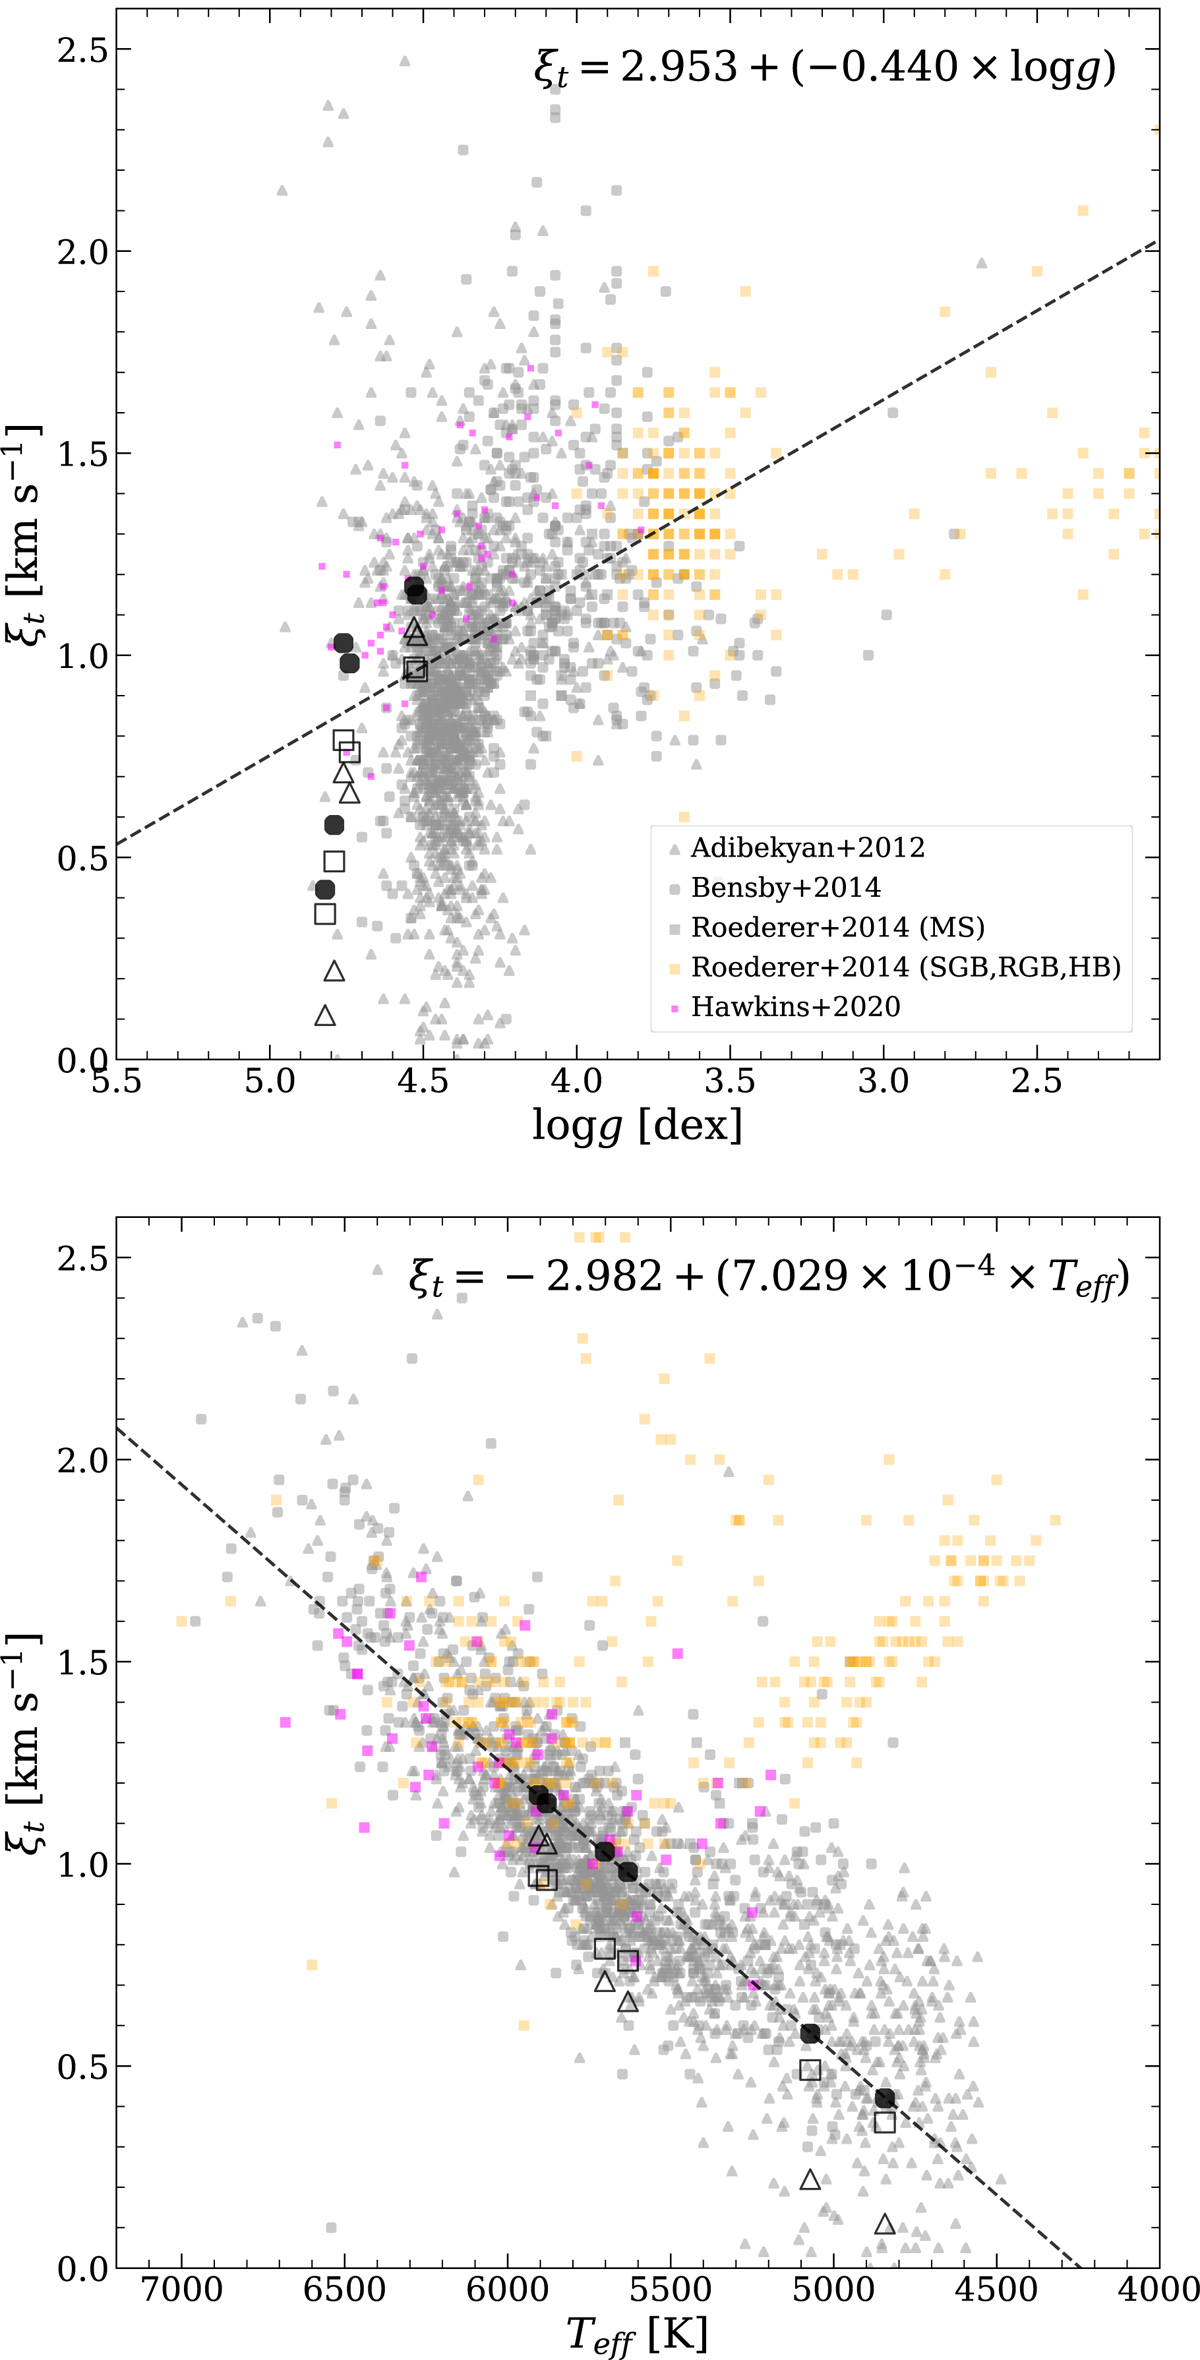
ξt − log g (top panel) and ξt − Teff (bottom panel) correlations for the literature data, which are FGK dwarf stars of Adibekyan et al. (2012, grey triangles), FG dwarf stars of Bensby et al. (2014, grey circles) main-sequence to horizontal-branch stars of Roederer et al. (2014, grey and orange squares), and main-sequence stars of Hawkins et al. (2020, magenta squares). The dashed lines represent the least-squares fit of the data excluding non-main-sequence stars of Roederer et al. (2014) and stars with Teff < 5000 K of Adibekyan et al. (2012) and Bensby et al. (2014). The ξt has a better correlation with Teff than log g. Black circles are our target stars with ξt values obtained from Eq. (3). Open triangles and squares shows different ξt values estimated using the equations of Boeche & Grebel (2016) and Mashonkina et al. (2017), respectively.
Current usage metrics show cumulative count of Article Views (full-text article views including HTML views, PDF and ePub downloads, according to the available data) and Abstracts Views on Vision4Press platform.
Data correspond to usage on the plateform after 2015. The current usage metrics is available 48-96 hours after online publication and is updated daily on week days.
Initial download of the metrics may take a while.