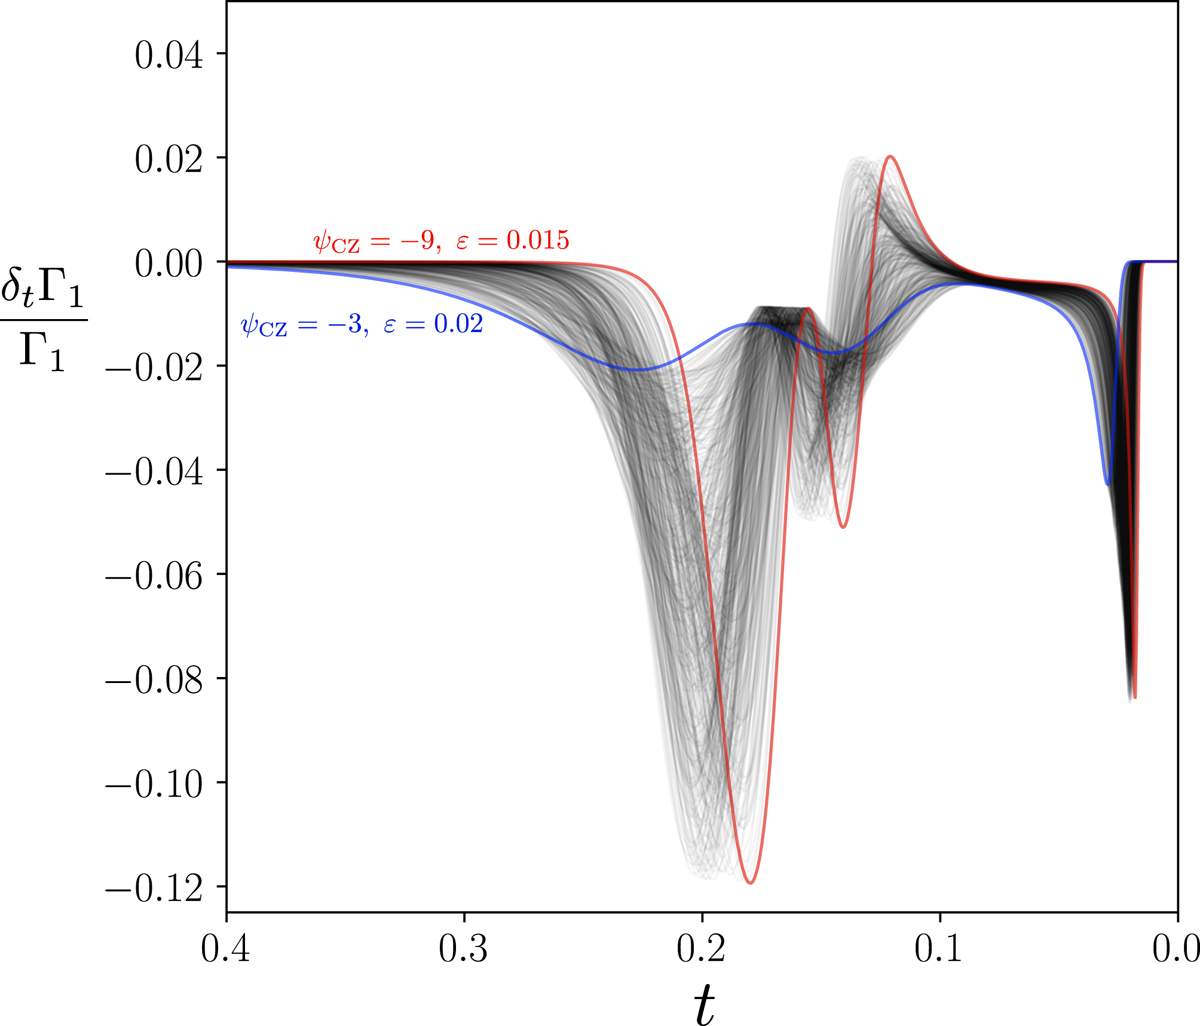
Fig. 9.
Download original image
Profile differences δtΓ1/Γ1 again obtained for a fixed value of δYs = 0.25, but from a pure-hydrogen reference model Ys = 0. The 500 profile differences in this plot were obtained by randomly drawing the remaining two reference quantities (ψCZ, ε) in the 2D box [ − 9, −3]×[0.015, 0.02] (the ε interval has been reduced compared to Fig. 8 for clarity). Two opposite corners of this box are highlighted in red and blue.
Current usage metrics show cumulative count of Article Views (full-text article views including HTML views, PDF and ePub downloads, according to the available data) and Abstracts Views on Vision4Press platform.
Data correspond to usage on the plateform after 2015. The current usage metrics is available 48-96 hours after online publication and is updated daily on week days.
Initial download of the metrics may take a while.