Fig. 7.
Download original image
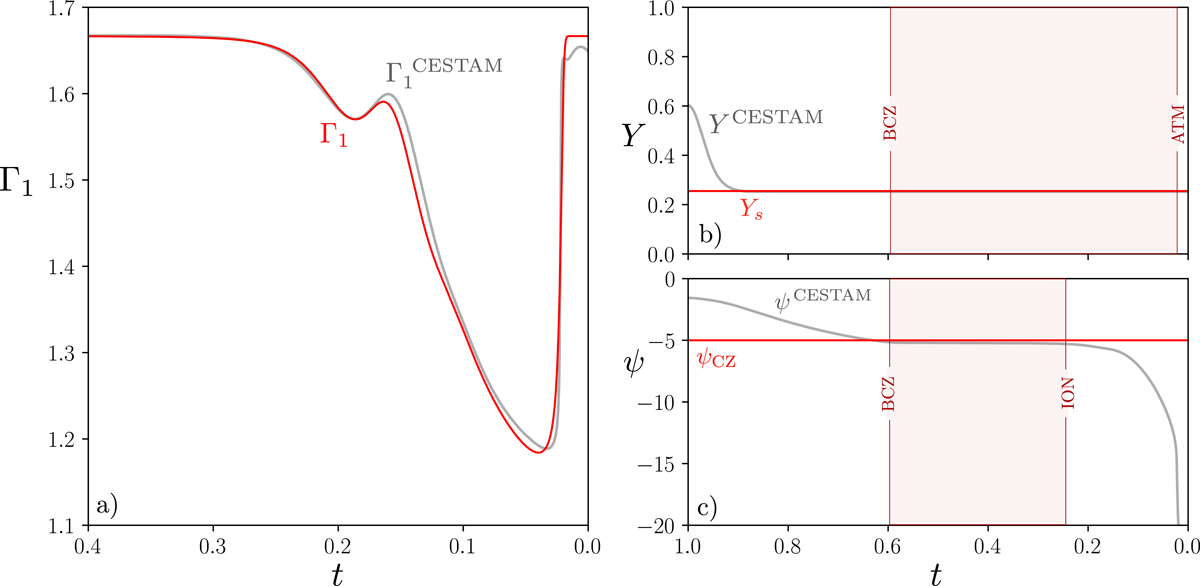
Correspondence between the CESTAM profiles and their respective analogues in our model. (a) Comparison of ![]() extracted from a CESTAM solar model (in grey) and
extracted from a CESTAM solar model (in grey) and ![]() obtained from our model (in red). (b) Comparison of YCESTAM(t) extracted from the same model with
obtained from our model (in red). (b) Comparison of YCESTAM(t) extracted from the same model with ![]() . (c) Comparison of ψCESTAM(t) with
. (c) Comparison of ψCESTAM(t) with ![]() . In the last two panels, the regions in which the curves are expected to correspond are shaded in red.
. In the last two panels, the regions in which the curves are expected to correspond are shaded in red.
Current usage metrics show cumulative count of Article Views (full-text article views including HTML views, PDF and ePub downloads, according to the available data) and Abstracts Views on Vision4Press platform.
Data correspond to usage on the plateform after 2015. The current usage metrics is available 48-96 hours after online publication and is updated daily on week days.
Initial download of the metrics may take a while.