Fig. 3.
Download original image
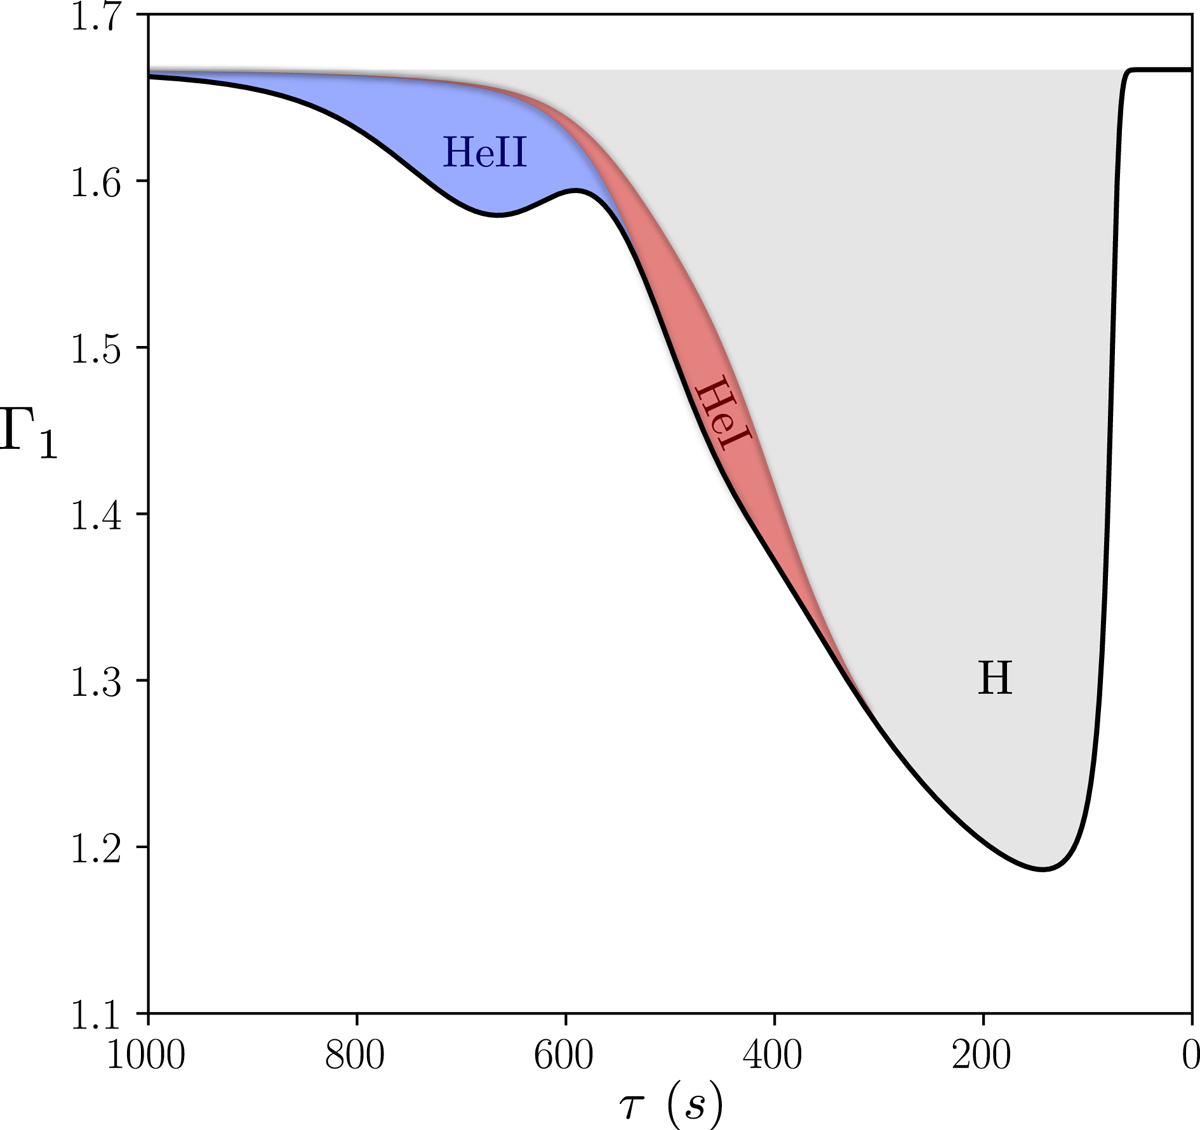
Representation of a typical Γ1 profile in the ionisation region as a function of the acoustic depth τ (the surface corresponds to τ = 0). The helium abundance in this plot is Y ∼ 0.25. The contributions of the three main ionisation zones have been distinguished, i.e., the hydrogen (H), the first (HeI), and second (HeII) helium ionisation zones. Each of them causes a deviation from the Γ1 reference value of 5/3.
Current usage metrics show cumulative count of Article Views (full-text article views including HTML views, PDF and ePub downloads, according to the available data) and Abstracts Views on Vision4Press platform.
Data correspond to usage on the plateform after 2015. The current usage metrics is available 48-96 hours after online publication and is updated daily on week days.
Initial download of the metrics may take a while.