Fig. 11.
Download original image
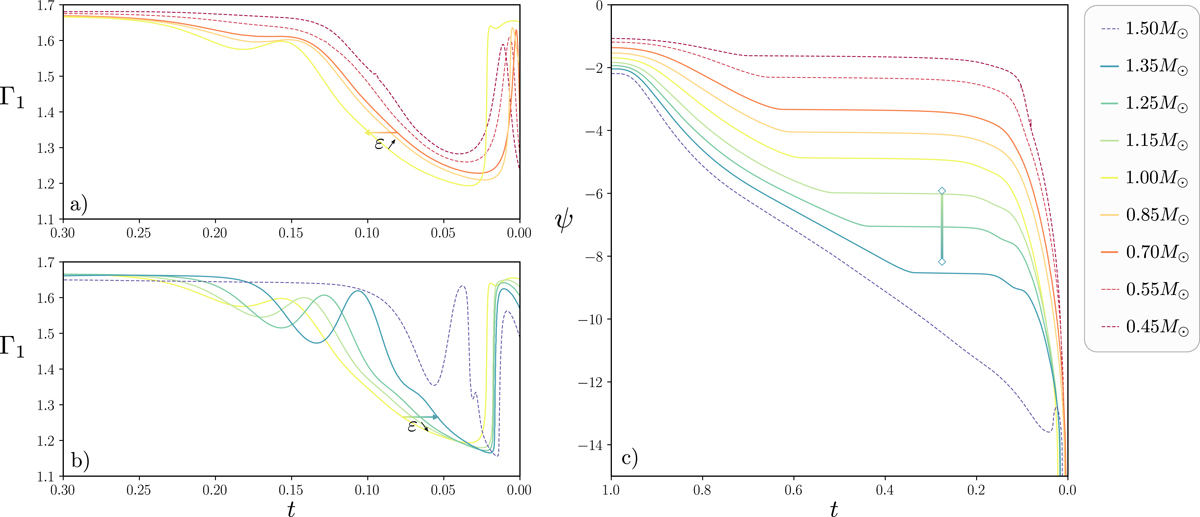
Γ1(t) (both panels a & b for clarity) and ψ(t) (panel c) profiles extracted from CESTAM early main sequence models with masses ranging from 0.7 M⊙ to 1.35 M⊙ (and from 0.45 M⊙ to 1.5 M⊙ as an indication in dashes). All models share the same composition which is the solar one as well as the same evolutionary state: Xc = 0.6. The qualitative variations of ε with mass are represented as well as the ψ span corresponding to the mass uncertainty of HD 52265 taken from Lebreton & Goupil (2014).
Current usage metrics show cumulative count of Article Views (full-text article views including HTML views, PDF and ePub downloads, according to the available data) and Abstracts Views on Vision4Press platform.
Data correspond to usage on the plateform after 2015. The current usage metrics is available 48-96 hours after online publication and is updated daily on week days.
Initial download of the metrics may take a while.