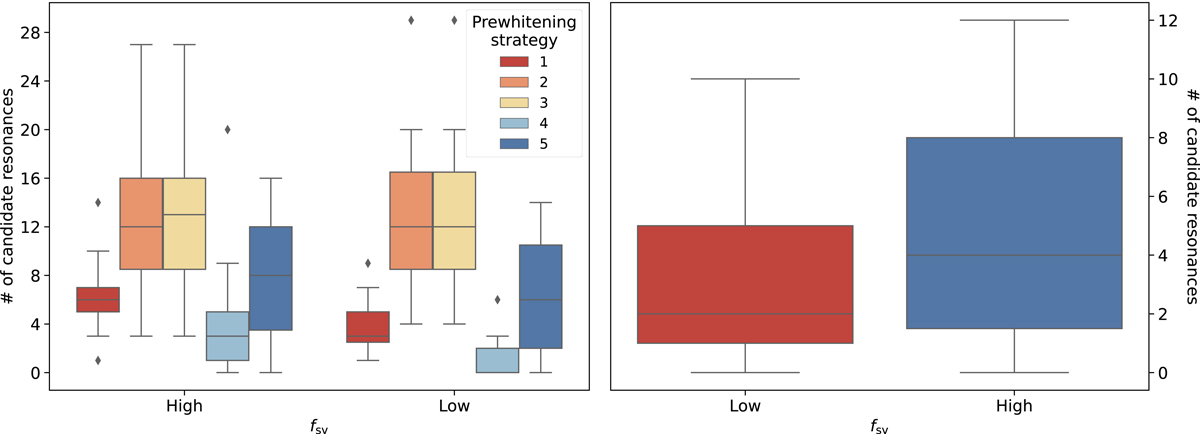
Fig. 9.
Download original image
Box-and-whisker plots of the number of identified two-signal candidate resonances or the number of identified robust two-signal candidate resonances (defined by Eq. (9)), grouped by the pseudo-classes defined in this work: low and high fsv. Left panel: box-and-whisker plot of the number of identified two-signal candidate resonances. The colour depicts the pre-whitening strategy employed to generate the light curve models. Right panel: box-and-whisker plot of the number of identified robust two-signal candidate resonances. Whiskers and outliers for both panels are indicated in a similar way to how they are indicated in Fig. 5.
Current usage metrics show cumulative count of Article Views (full-text article views including HTML views, PDF and ePub downloads, according to the available data) and Abstracts Views on Vision4Press platform.
Data correspond to usage on the plateform after 2015. The current usage metrics is available 48-96 hours after online publication and is updated daily on week days.
Initial download of the metrics may take a while.