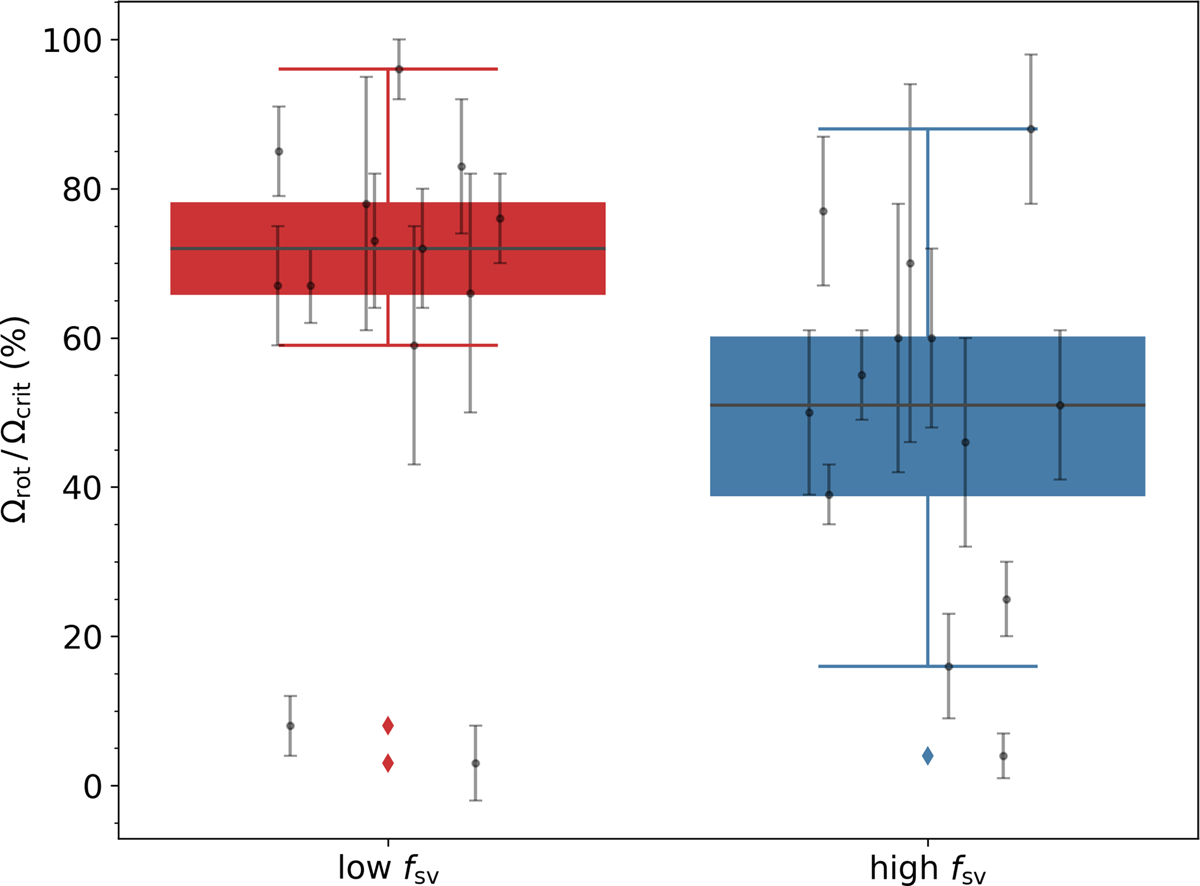
Fig. 5.
Download original image
Box-and-whisker plot of the rotation rates of 26 SPB stars obtained from averaging over eight theories of core-boundary and envelope mixing by Pedersen et al. (2021). These are grouped into the two classes defined in this work: low and high fsv, as indicated schematically on the x axis. Whiskers are extended past the quartiles by maximally 1.5 times the interquartile range. Outliers are indicated with a rhombus mark. Individual rotation rates and estimated standard deviations are indicated in grey. The horizontal offset for these rotation rates is imposed for reasons of visibility, without any additional meaning.
Current usage metrics show cumulative count of Article Views (full-text article views including HTML views, PDF and ePub downloads, according to the available data) and Abstracts Views on Vision4Press platform.
Data correspond to usage on the plateform after 2015. The current usage metrics is available 48-96 hours after online publication and is updated daily on week days.
Initial download of the metrics may take a while.