Fig. 4.

Download original image
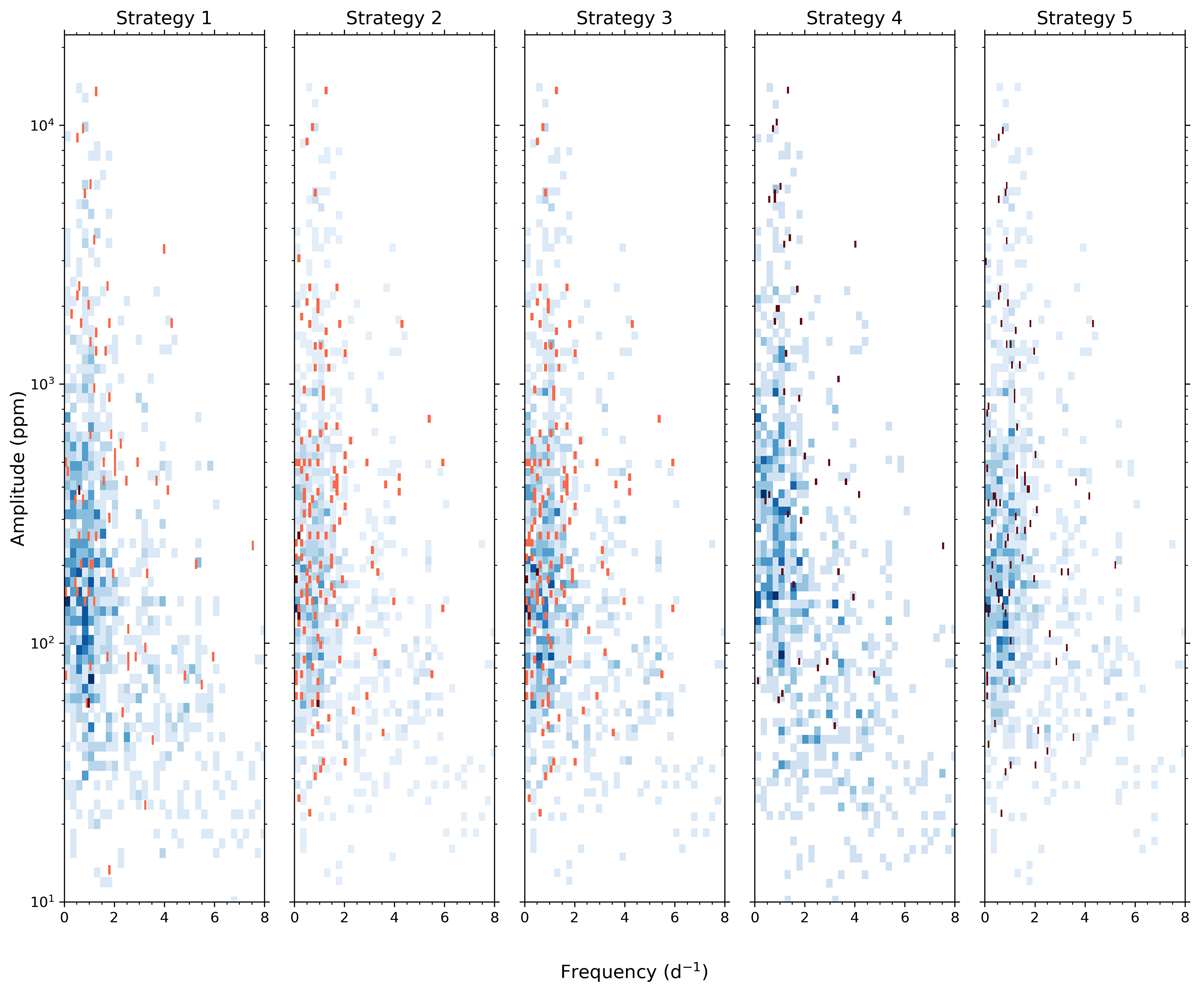
Distribution of the amplitudes and frequencies of (independent) signals not identified as combination frequencies for all 38 SPB stars in our sample, for each of the pre-whitening strategies defined in Table 1. The colour indicates if these signals are involved in a candidate resonance (red) or not (blue), and its gradient indicates the number of detected frequencies: Colours are brighter if more signals are detected within a specific amplitude-frequency bin. The red and blue distributions are plotted independently, so overlap between these distributions is the cause for the appearance of darker, maroon-like coloured bins belonging to the red distribution. The maximal frequency displayed in each panel is 8 d−1, which is the highest frequency of any of the detected (robust two-signal) candidate resonances (see Sect. 4 and, especially, Fig. 10). We display independent signals with an amplitude > 10 ppm because very few independent signals have amplitudes smaller than this limit.
Current usage metrics show cumulative count of Article Views (full-text article views including HTML views, PDF and ePub downloads, according to the available data) and Abstracts Views on Vision4Press platform.
Data correspond to usage on the plateform after 2015. The current usage metrics is available 48-96 hours after online publication and is updated daily on week days.
Initial download of the metrics may take a while.


