Fig. 3.
Download original image
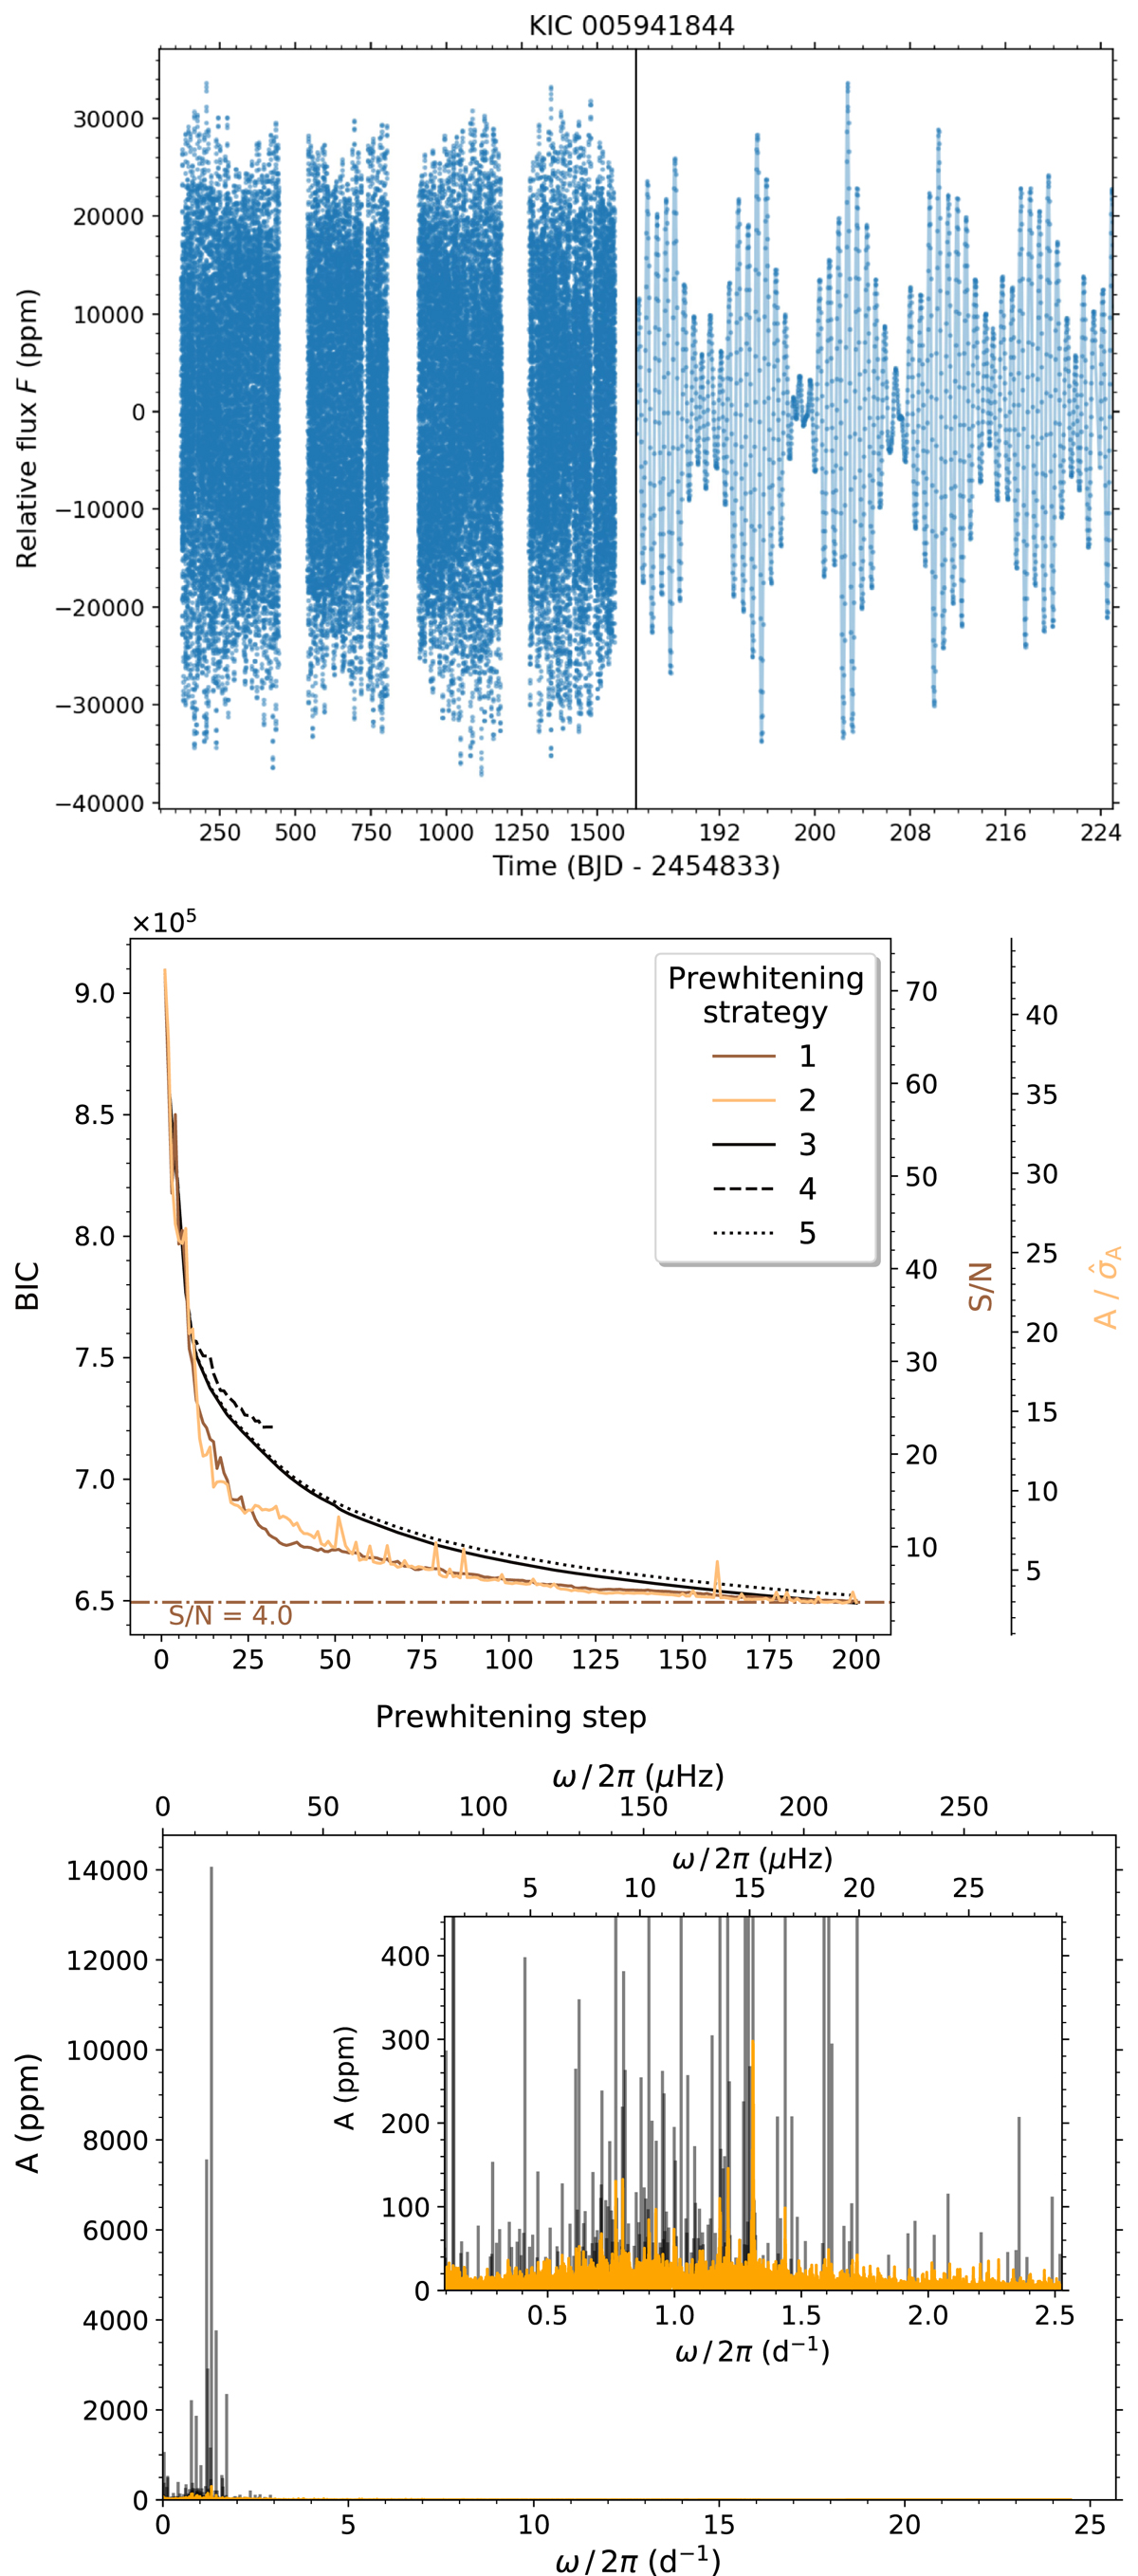
Light curve, pre-whitening and pulsation characteristics for the high-fsv star KIC005941844. Top: full light curve (left) and a small part of the light curve that indicates its multi-periodic constant-frequency nature (right). Middle: comparison of the different stop criteria used for the five pre-whitening strategies throughout the iterative pre-whitening procedure, applied to the light curve. The BIC values are relevant for strategies 3, 4, and 5, whereas the S/N value and the estimated amplitude A expressed in estimated standard deviations ![]() are relevant for strategies 1 and 2, respectively. Bottom: LS periodogram (in orange) obtained after subtracting the light curve model obtained by pre-whitening strategy 3, from the original light curve. The extracted frequencies for this model are displayed as grey lines with height equal to the extracted amplitude. We note the different y-axis scale for the inset compared to the main panel.
are relevant for strategies 1 and 2, respectively. Bottom: LS periodogram (in orange) obtained after subtracting the light curve model obtained by pre-whitening strategy 3, from the original light curve. The extracted frequencies for this model are displayed as grey lines with height equal to the extracted amplitude. We note the different y-axis scale for the inset compared to the main panel.
Current usage metrics show cumulative count of Article Views (full-text article views including HTML views, PDF and ePub downloads, according to the available data) and Abstracts Views on Vision4Press platform.
Data correspond to usage on the plateform after 2015. The current usage metrics is available 48-96 hours after online publication and is updated daily on week days.
Initial download of the metrics may take a while.