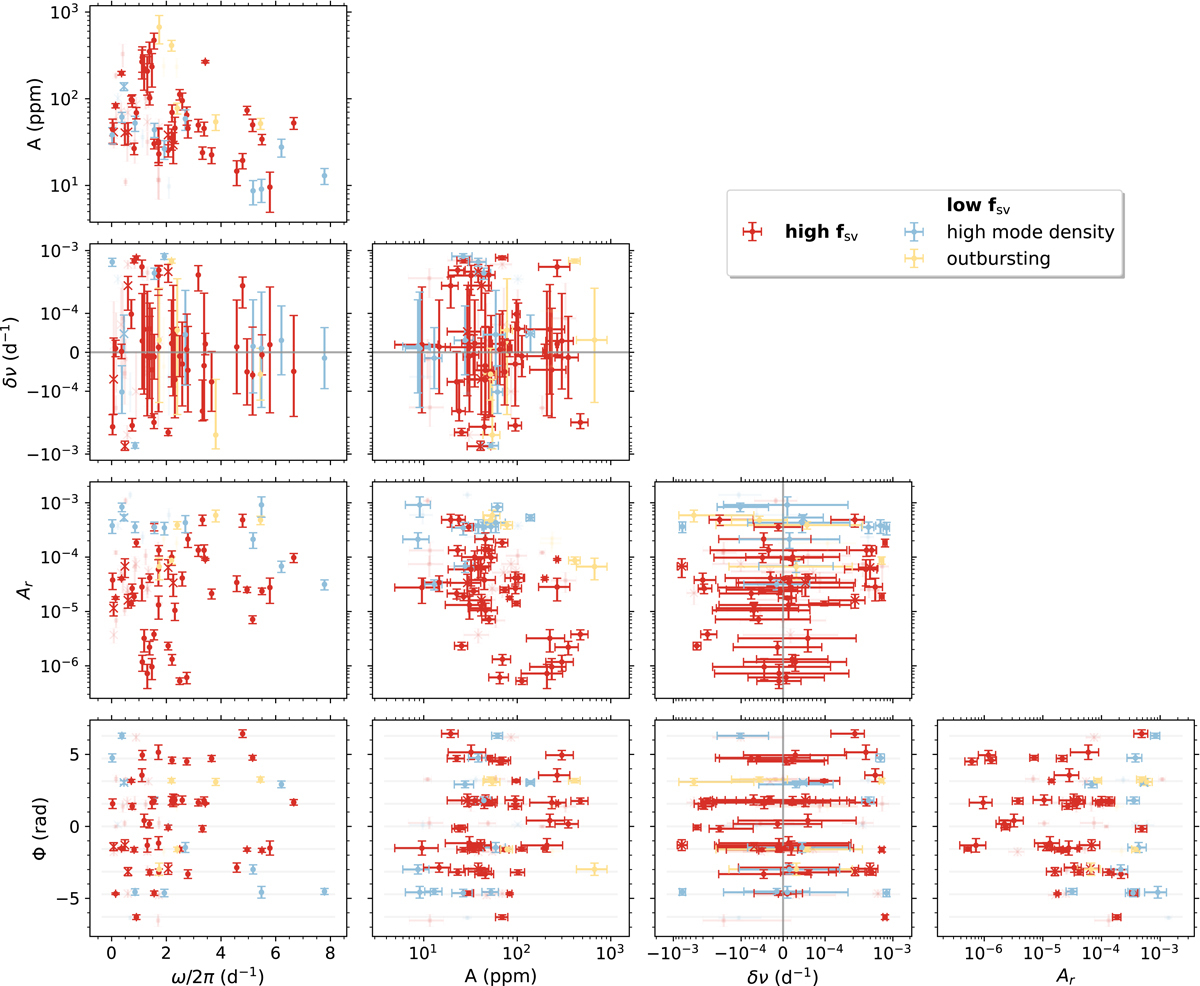
Fig. 10.
Download original image
Highest-fsv strategy characteristic properties of the identified robust candidate resonances, which involve the two largest-amplitude signals, as a function of each other, with 1σ uncertainties indicated: amplitude A, frequency ω/2π, frequency de-tuning δν (see Eq. (4)), relative phase Φ (see Eq. (5)), and relative amplitude Ar (see Eq. (6)). Colours indicate the different pseudo-classes to which the stars that exhibit the candidate resonances belong. The transparent symbols indicate robust candidate resonances having 4 < S/N < 5, whereas the full symbols indicate robust candidate resonances for which S/N ≥ 5. Grey lines indicate the zero point for the frequency de-tuning, and the faint grey horizontal lines in the last row of panels indicate the relative phases that satisfy Eq. (5).
Current usage metrics show cumulative count of Article Views (full-text article views including HTML views, PDF and ePub downloads, according to the available data) and Abstracts Views on Vision4Press platform.
Data correspond to usage on the plateform after 2015. The current usage metrics is available 48-96 hours after online publication and is updated daily on week days.
Initial download of the metrics may take a while.