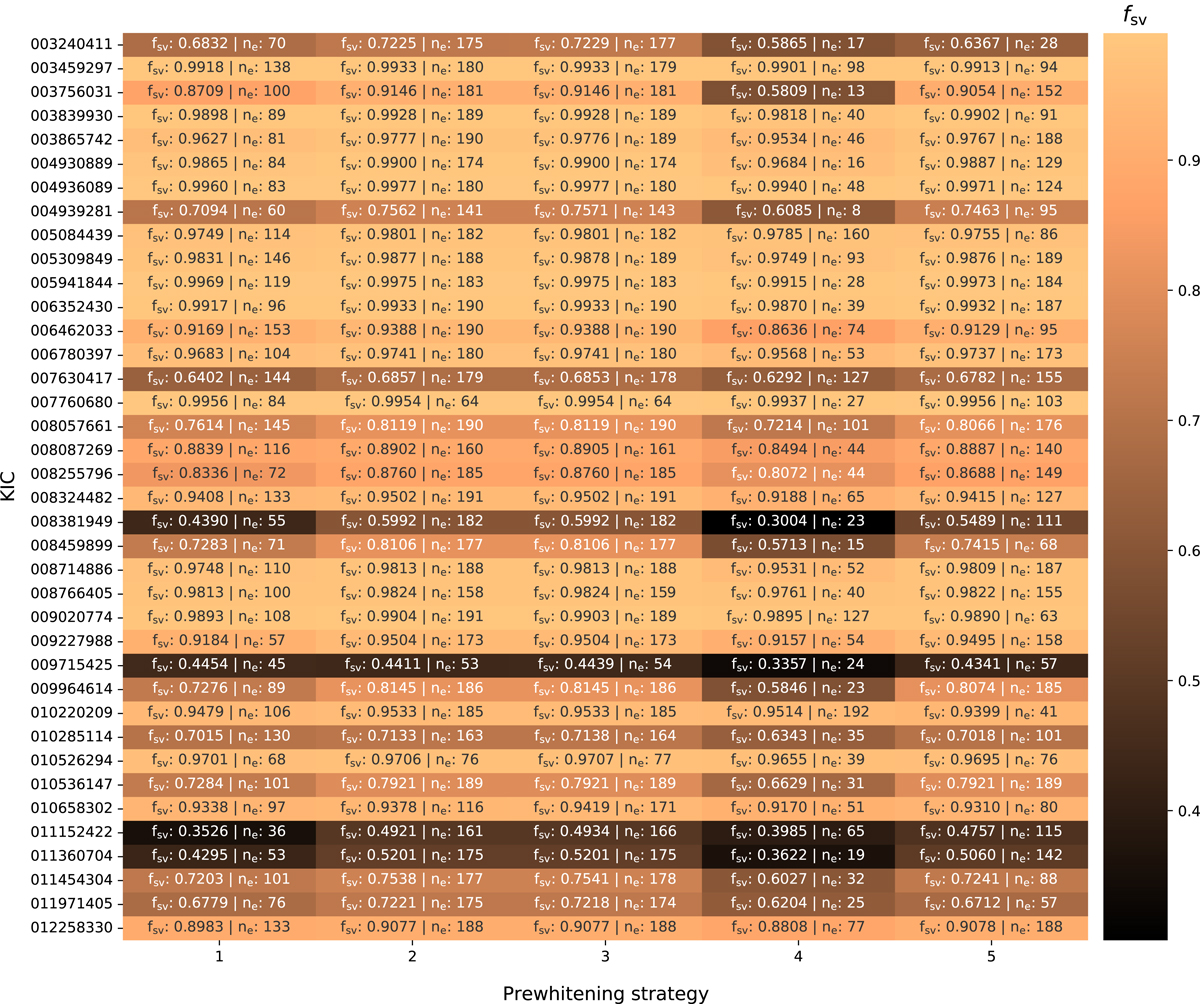
Fig. 1.
Download original image
Comparison of the scaled fraction of variance fsv values of the resulting light curve regression models obtained for the different pre-whitening strategies applied to the stars in the sample, with colouring as a function of fsv. Each cell contains the fsv value as computed using Eq. (3), as well as the total number of frequencies extracted using this approach, ne. The number ne and the fsv value are computed after the frequency filtering step has removed any unresolved frequencies with respect to the LD78 criterion and any signals that have insignificant amplitudes (at 95% confidence), as discussed in Sect. 2.2.
Current usage metrics show cumulative count of Article Views (full-text article views including HTML views, PDF and ePub downloads, according to the available data) and Abstracts Views on Vision4Press platform.
Data correspond to usage on the plateform after 2015. The current usage metrics is available 48-96 hours after online publication and is updated daily on week days.
Initial download of the metrics may take a while.