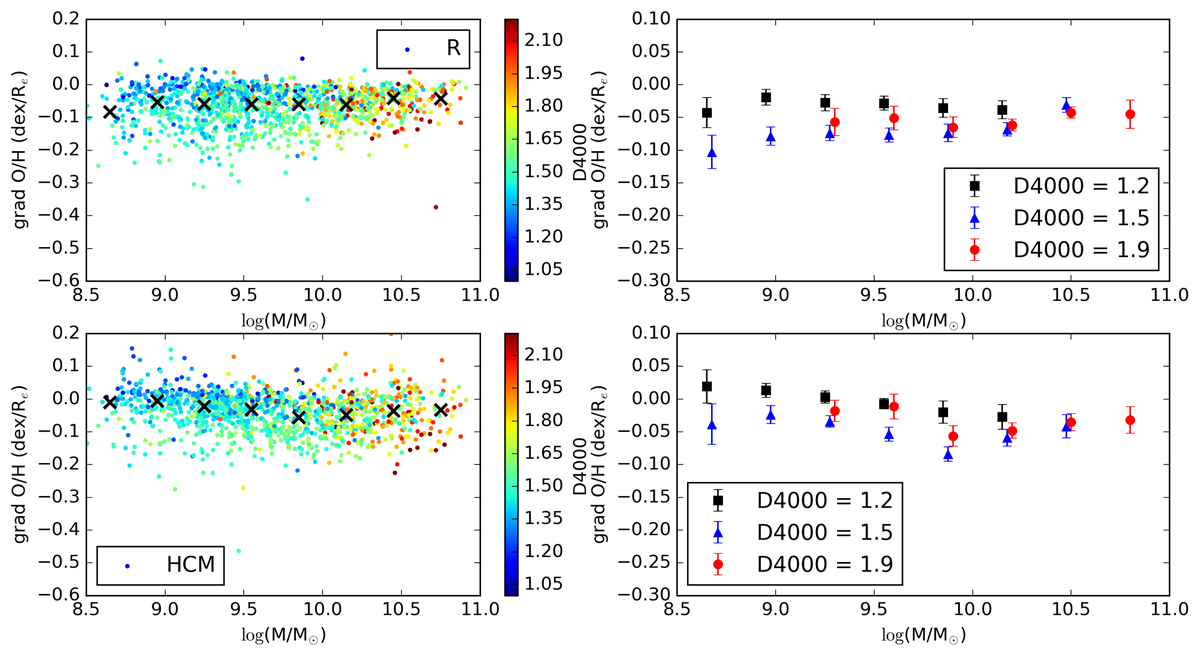
Fig. 7.
Download original image
Oxygen abundance gradient as a function of the stellar mass and the D(4000) index for abundances derived either from the R calibration (top panels) or using the HCM method (bottom panels). Left panels: O/H gradient as a function of the stellar mass of a galaxy with colour-coded D(4000) for individual galaxies; crosses are median values in each mass bin. Right panels: median O/H gradient with 2σ CI in each mass bin for three sub-samples of galaxies with different ranges of the D(4000) index: 1.0–1.4 (black), 1.4–1.6 (blue), and 1.6–2.2 (red).
Current usage metrics show cumulative count of Article Views (full-text article views including HTML views, PDF and ePub downloads, according to the available data) and Abstracts Views on Vision4Press platform.
Data correspond to usage on the plateform after 2015. The current usage metrics is available 48-96 hours after online publication and is updated daily on week days.
Initial download of the metrics may take a while.