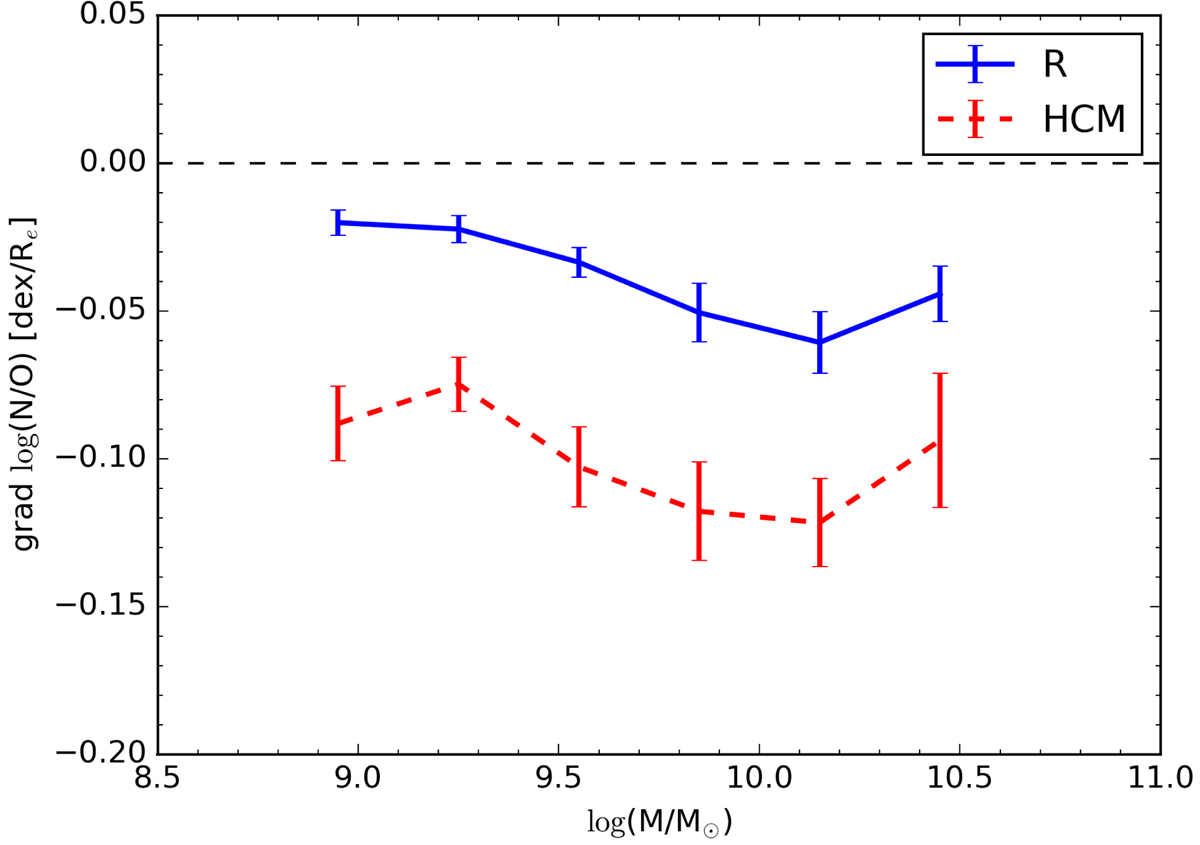
Fig. 6.
Download original image
Median N/O ratio gradient as a function of the galaxy mass for a sample of galaxies with a flat oxygen abundance gradient. The abundances are either derived from the R calibration (blue solid) or using the HCM method (red dashed). Error bars show the standard deviation divided by the square root of the number of data points in each mass bin. For reference, a horizontal dashed line shows the zero level of the N/O ratio gradient.
Current usage metrics show cumulative count of Article Views (full-text article views including HTML views, PDF and ePub downloads, according to the available data) and Abstracts Views on Vision4Press platform.
Data correspond to usage on the plateform after 2015. The current usage metrics is available 48-96 hours after online publication and is updated daily on week days.
Initial download of the metrics may take a while.